Scientists at Broad MIT are working on a new feature-packed and "lightning fast" version of Admixtools that runs in R. It's already available via this link...
uqrmaie1.github.io/admixtools
I don't have access to a Linux machine right now, but since this thing runs in R then it also runs in Windows, and I do have a Windows computer here.
One of the most interesting and useful features in the new R package is arguably the
find_graphs function, which automatically searches for admixture graphs that reflect the observed f-statistics. That is, once the user chooses the samples and settings,
find_graphs runs an unsupervised admixture graph analysis.
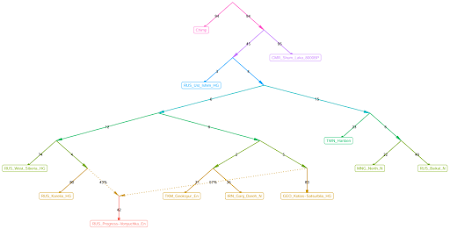
Here are a couple of graphs that I knocked out with
find_graphs in about five minutes each. The commands and settings that I used are listed in a text file
here.
The two topologies above were among the most commonly seen in a series of about 50 runs with the same sample set. A couple of basic inferences based on the output:
- RUS_Progress-Vonyuchka_En harbors GEO_Kotias-Satsurblia_HG-related ancestry, not IRN_Ganj_Dareh_N-related ancestry
- IRN_Ganj_Dareh_N and TKM_Geoksyur_En form a clade to the exclusion of GEO_Kotias-Satsurblia_HG.
The results are certainly in line with those from other types of analyses that I've done on this blog (for instance, see
here and
here).
Update 05/01/21: Robert Maier, one of the creators of Admixtools2, has left this message in the
comments below.
I'm glad to see that there is so much interest in Admixtools2! I very much appreciate any comments and suggestions on how to improve it and how to make it more user friendly.
Because it's still under active development, some things are likely to change in the future. For example, there is a faster successor to "find_graphs", called "find_graphs2", but in the future they will probably be merged into one.
I'm in David Reich’s group at Harvard and Broad and we are hoping to publish a paper describing Admixtools2 where we illustrate its value by using it to test how robust several previously published results are by exploring a large number of alternative models for each of them. If any of you use Admixtools2 to find graphs that are significantly better fits than published graphs and are also historically plausible - or if you find families of graphs that are equally good fits to the published ones but provide qualitatively different conclusions about population relationships - please contact us. That would be a meaningful contribution to the paper we write about this and we’d be open to including someone as a co-author based on identifying case studies like this.


