search this blog

Saturday, May 14, 2016

D-stats/nMonte open thread #2


I put together a couple of D-stats datasheets featuring the Ice Age European samples from Qiaomei Fu et al. 2016. They're available for download here and here, and can be used as input for nMonte and 4Mix. For instance, a couple of models using nMonte:

Villabruna
ElMiron 99.8
Anatolia_Neolithic 0.2
AfontovaGora3 0
Esan_Nigeria 0
GoyetQ116-1 0
Kostenki14 0
Kotias 0
MA1 0
Neandertal_Altai 0
Ulchi 0
Vestonice16 0

distance%=5.9112 / distance=0.059112

Kotias
Anatolia_Neolithic 56.45
Kostenki14 24.1
AfontovaGora3 18.1
Esan_Nigeria 1.35
ElMiron 0
GoyetQ116-1 0
MA1 0
Neandertal_Altai 0
Ulchi 0
Vestonice16 0
Villabruna 0

distance%=8.3858 / distance=0.083858

Update 17/05/2016: I wanted to see what would happen if I changed the formula from D(Chimp,Rows)(Mbuti,Columns) to D(Chimp,Columns)(Mbuti,Rows). The new datasheets are available here and here. The results are very similar, although never identical, and I'm not sure at the moment which set of sheets works better.

Villabruna
ElMiron 99.5
Anatolia_Neolithic 0.5
AfontovaGora3 0
Esan_Nigeria 0
GoyetQ116-1 0
Kostenki14 0
Kotias 0
MA1 0
Neandertal_Altai 0
Ulchi 0
Vestonice16 0

distance%=5.8334 / distance=0.058334

Kotias
Anatolia_Neolithic 69.5
AfontovaGora3 24.3
Ulchi 5.35
Kostenki14 0.85
ElMiron 0
Esan_Nigeria 0
GoyetQ116-1 0
MA1 0
Neandertal_Altai 0
Vestonice16 0
Villabruna 0

distance%=8.6196 / distance=0.086196

See also...

Yamnaya = Khvalynsk + extra CHG + maybe something else

D-stats/nMonte open thread

D-stats/4mix tour of ancient Eurasia

Friday, May 6, 2016

Villabruna cluster =/= Near Eastern migrants


I've been running a lot of Treemix analyses with the samples from the recent Qiaomei Fu et al. paper. And the impression I'm getting is that the authors missed the elephant in the room; the one with R1b painted on its big butt.

Now, it's true that Treemix output can't be used as unambiguous evidence in support of complex models. That's because in the absence of key samples the algorithm can get exceedingly creative in modeling the available data, sometimes to such extremes that the results might seem absurd.

However, when something keeps showing up again and again, even when using somewhat different samples and marker sets, and makes sense in the context of haploid and archaeological data, then at the very least it deserves serious consideration.

Here's a nice Treemix series that more or less captures the meat and potatoes of my many Treemix experiments with the Qiaomei Fu et al. dataset. For the archaeological contexts and other details about these ancient samples see here.


Below is my interpretation of the results:

- Villabruna is a sister clade of the earlier European Vestonice clade, but with significant input from an AfontovaGora3-related North Eurasian population, perhaps one that was living north of the Black Sea after the Kostenki people went the way of the dodo

- Hence, the R1b lineage carried by Villabruna I9030, the individual in this Treemix series, probably comes from the Eurasian steppe

- Kotias, a Caucasus Hunter-Gatherer, is in large part derived from the same North Eurasian population, hence the close relationship between Villabruna and Caucasus Hunter-Gatherers

- Villabruna and/or closely related foragers contributed significant ancestry to Neolithic Anatolians, and thus, indirectly, possibly to all extant Near Eastern and even many African populations

- Kotias is also closely related to Neolithic Anatolians, but probably mostly via a more basal population, perhaps the so called Basal Eurasians, native to the Near East prior to the Villabruna and/or related gene flow across the Near East and parts of Africa

- Present-day East Asians might be ancient hybrids with admixture from the same or very similar North Eurasian population, although as per the above mentioned quirks of Treemix, it's possible that the North Eurasians that contributed ancestry to Villabruna, Caucasus foragers and Eurasian steppe populations were in fact partly East Asian

So basically what I'm seeing are back migrations from Europe and the Eurasian steppe or Siberia to the Near East soon after the Ice Age. Yes, from Europe, although I admit that things can get fuzzy here.

That's because at the time much of the Aegean Sea was dry land, and thus there was no geographic barrier between the European Balkans and Asian Anatolia. The two regions, which might seem very distinct to us today, were basically one. So when I say Europe, I actually mean the ancient landmass now divided between the Balkans and Anatolia.

Or not? Are there any D-stats that we can run to either confirm or debunk my Treemix-based hypothesis? Feel free to post your proposals in the comments and I'll try and run them as soon as possible.

Update 07/05/2016: The plot thickens somewhat. I added MA1 to the line up, and now Villabruna shows minor Kotias-related ancestry. In other words, probably something from the Caucasus. The full series is available in a zip file here.


However, although interesting, this result doesn't change much. In fact, it adds more weight to the argument that Villabruna inherited his Y-chromosome from steppe foragers. That's because if this migration edge was a reflection of gene flow from Anatolia to Europe, I'd expect it to run from the Anatolia Neolithic branch, rather than the Kotias branch.

See also...

Following the mammoth herds?

Thursday, May 5, 2016

On the modern genetic affinities of Ice Age Europeans


Apparently most of them didn't contribute much to our genomes. But for what it's worth, I tested their present-day affinities, and those of several other ancients, with f3 outgroup stats of the form f3(Test,X;Mbuti). For the archaeological contexts and other details about these ancient samples see here.


Not long ago Basques were thought to be by far the best proxies for Upper Paleolithic Europeans; almost a genetic relict from Ice Age Iberia. Clearly, this is not what they are, but they do share relatively high drift with the El Miron lady, which perhaps suggests some genetic continuity in Basque Country for almost 20,000 years. This would still be a remarkable story if confirmed via multiple lines of evidence.

Below are a couple of examples of what can be done with these stats. It's pretty clear that the Vestonice cave men show a preference for Northeast Europeans, in particular Balts, Estonians and Poles. On the other hand, Kostenki14 shares the highest drift with the Dutch, mostly north of the Rhine Dutch. Might that be meaningful in some way?

Are there any other interesting patterns in this data? Please note, however, that it's not possible to compare the stats directly, because they're based on different numbers of markers.

Wednesday, May 4, 2016

Ice Age Europeans in a global PCA


The datasheet can be downloaded here. It might be possible to model many of the populations in the PCA as mixtures of Ice Age Europeans and other ancients using nMonte, but I haven't tried this yet. Most of the samples in this run are from various Reich lab public data releases available here.
See also...

On the modern genetic affinities of Ice Age Europeans

PC/nMonte open thread

For a typical West Eurasian PCA, the Epipaleolithic is the final frontier

Tuesday, May 3, 2016

For a typical West Eurasian PCA, the Epipaleolithic is the final frontier


My dataset now includes the samples from Qiaomei Fu et al. 2016. They're freely available at the Reich lab website here.

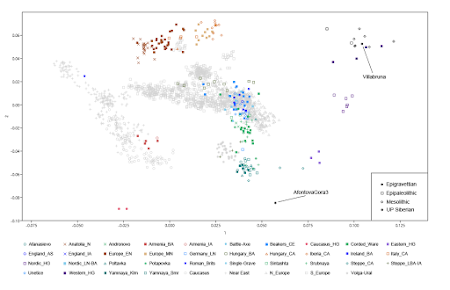
Below is a Principal Component Analysis (PCA) featuring 10 of the freshly sequenced genomes from the paper classified as Epigravettian, Epipaleolithic and Mesolithic, as well as the Siberian (late?) Upper Paleolithic forager Afontova Gora 3.

I did try to include all of the new genomes from the paper on the plot, but most were getting results that didn't make any sense. They were simply too old and too far removed in terms of genetic structure from present-day West Eurasians. But that's OK. I can analyze them with formal statistics, and promise to do so vigorously in the coming weeks.

By the way, Villabruna is the ~14,000 year old genome from Italy belonging to Y-chromosome haplogroup R1b. Gioiello, you still breathing?

See also...

Ice Age Europeans in a global PCA

Sunday, April 17, 2016

Estimating Basal Eurasian ancestry?


Basal Eurasians (BE) are a hypothetical ghost population that apparently split from other Eurasians no later than 45,000 years ago. If they actually existed, they had a significant impact on the ancestry of early Neolithic farmers, and thus all present-day West Eurasians.

Testing ancestry proportions from ghost populations isn't easy. However, Haak et al. 2015 made use of an f4 equation that seemingly gave an accurate estimate of BE admixture in LBK farmer Stuttgart: f4(Stuttgart,Loschbour;Onge,MA1)/f4(Mbuti,MA1;Onge,Loschbour) = 44%. The other LBK farmers scored an average of 40% BE, which also made sense.

Unfortunately, this equation doesn't appear to work too well for Caucasus Hunter-Gatherers (CHG) Kotias and Satsurblia. They both score around 25% BE, which, as far as I can see, seems way too low. Perhaps using MA1 in the equation is messing things up because CHG harbor significant MA1-related ancestry?

I tinkered around with Haak's equation and came up with this: f4(X,Iberia_Mesolithic;Dai,Karelia_HG)/f4(Mbuti,Karelia_HG;Dai,Iberia_Mesolithic). The results look solid, at least in relative terms (see image below). But is the equation actually valid?

My main worry is using both Iberia Mesolithic and Karelia HG. They share a lot of drift, much more than Loschbour and MA1. Also, even though both Dai and Onge belong to the so called Eastern non-African (ENA) clade, they're quite distinct, with Dai a lot less basal in the context of ENA diversity. Any thoughts? Suggestions?


Update 04/18/2016: Interestingly, my f4 equation essentially fails for most post-Neolithic Europeans, particularly those with relatively high ratios of Karelia HG-related ancestry. For instance, Yamnaya Kalmykia scores just 2.9% BE, which can't be right. Yamnaya Samara shows -2.2%, which is obviously wrong.

But I tried several combinations of reference samples and found that by replacing Karelia HG with Hungary HG and Dai with Ust-Ishim I was able to obtain coherent results for a wider range of groups, including Yamnaya.


To be honest, I still don't know what the hell I'm testing here exactly. The results appear to reflect the existence of two components within West Eurasia; one representing ancient hunter-gatherers from Europe and probably surrounding areas of the Near East, and another closely related to present-day Near Eastern populations. The latter might well be a signal of the so called Basal Eurasians, or perhaps a number of as yet unsampled meta populations from the ancient Near East?

Monday, March 28, 2016

PCA/nMonte open thread


Below are a few nMonte models of ancient individuals based on 25 principal components (PCs). The relevant datasheet and nMonte R script can be downloaded here and here, respectively.


Many of the outcomes are basically perfect. Others could certainly be better. But they all make sense.

The more complex the ancestry, the more difficult it is to model. Also, deamination, low coverage and missing markers are probably skewing things to some degree for most of these samples. So although time consuming, it might be a good idea to use population averages minus the most obvious outliers.

Are there any other ways to improve the analysis? Is 25 dimensions too much or too little? Let's run plenty of tests and see where this takes us.

I can update the datasheet with many more populations and dimensions later this week. Feel free to post your requests in the comments and I'll run them if I have them. Also, if anyone's wondering, I don't know yet which commercial genotype files I can run in this test, if any. I'll check.

Update 04/04/2016: A modified datasheet with 50 dimensions and many more samples is available here. It should be more useful in modeling South Central Asians, especially the Kalash. However, as far as I can tell, using just 9 dimensions, like in the version here, is faster and produces more accurate results.

Wednesday, March 16, 2016

Sintashta, BMAC and the Indo-Iranians


I'm perusing the online archives of Harvard Sanskrit Professor Michael Witzel. The links below are worth checking out for some background info on the prehistory of Eastern Europe and Central Asia. There's a very cool map on page 6 of the second PDF.

Sintashta, BMAC and the Indo-Iranians. A query.

Linguistic Evidence for Cultural Exchange in Prehistoric Western Central Asia.

The Home of the Aryans.

Autochthonous Aryans? The Evidence from Old Indian and Iranian Texts.

Looking back, these old school linguistics articles make a lot more sense than most of the supposedly cutting-edge population genetics papers coming out at around the same time dealing with the Indo-Aryan question.

Many population geneticists back then took the view that the ancestors of the Indo-Aryans could not have spread from the European steppes to India because Y-chromosome haplogroup R1a apparently showed the greatest haplotype diversity in the Indus Valley. Well, what a load of crock that turned out to be.

See also...

The Poltavka outlier

Friday, March 11, 2016

D-stats/nMonte open thread


I'll start the ball rolling with a 9-way mixture analysis of 93 European, Near Eastern and Central Asian present-day and ancient populations. The relevant datasheet and R script are available here and here.


Below is a simple tree/cluster analysis based on the results, using the freely available Past3 software. Makes perfect sense, I'd say.


It's important to understand that these sorts of tests are basically designed to estimate ancient ancestry proportions, rather than calculate minor admixtures. With that in mind, here are a few observations:

- Karasuk outlier RISE497 (the most eastern Karasuk individual) is surprisingly important for Near Eastern populations

- Nordic LNBA and Sintashta look very similar in terms of overall ancestry proportions, suggesting that they perhaps derive from the same ancestral population

- The effects of postmortem deaminantion or DNA damage appear to be expressed in many of the non-UDG treated ancient samples as minor Sub-Saharan admixture

Can anyone put together a better model for West Eurasians? Also, I'd really like to see a well thought out D-stats/nMonte analysis of South Central Asia.

See also...

Yamnaya = Khvalynsk + extra CHG + maybe something else

D-stats/nMonte open thread #2

Sunday, March 6, 2016

D-stats/4mix tour of ancient Eurasia


This 4mix experiment is based on a series of statistics of the form D(Chimp,Reference_pop/Test_pop)(Mbuti,X), where X represents one of 9 ancient and present-day outgroups. The input data is available here. Feel free to try it yourself and post your models in the comments below.


Here's a Principal Component Analysis (PCA) based on the D-stats. As far as I can see, it makes very good sense. Click to enlarge.

See also...

Yamnaya = Khvalynsk + extra CHG + maybe something else

PC/nMonte open thread