search this blog

Friday, December 26, 2014

The fateful triangle


Not long ago Lazaridis et al. proposed that most present-day Europeans were derived from three distinct ancestral populations: Ancient North Eurasians (ANE), Early European Farmers (EEF) and Western European Hunter-Gatherers (WHG).

However, this is essentially a stop-gap model, which will in all likelihood be replaced by a partly revised and more robust model once someone manages to sequence a genome or two from the Neolithic Near East. That's because EEF is clearly a hybrid component, largely made up of ancient Near Eastern ancestry and something very WHG-like, sometimes in very different proportions depending on the location and archeological context of the EEF genomes being analyzed.

So what will this new model look like, you might ask? Probably like this, where EEF is replaced by an Early Neolithic Farmer (ENF) component from the ancient Near East, or something very similar:


The diagram above is basically a Principal Component Analysis (PCA) based on output from my new West Eurasia K8 test (see here), in which the Near Eastern component is synonymous with ENF.

I'm quite certain that these results are very close to the truth. However, just in case the Near Eastern ancestry proportions are a little bit too high (and we won't know until we see those ancient genomes from the Near East), I've got another version that offers lower bound Near Eastern estimates.


It might be useful to keep in mind that I rotated the plots to fit geography. As a result, Component 1, which packs around 85% of the variance on both plots, appears smaller than Component 2, which only carries around 10% of the variance.

A spreadsheet with West Eurasia K8 results for a wide variety of populations is available here. Please note that there are two sheets, with the second sheet showing the lower bound Near Eastern ancestry proportions.

We'll probably learn of more ancient European meta-populations as many more genomes are sequenced from across Eurasia. Nevertheless, I doubt this will affect the model outlined above. That's because I'm expecting all such meta-populations to be mixtures of ANE, ENF and/or WHG, as well as, in some cases, extra-West Eurasian components.

However, I suspect that West Eurasia will have to be modeled in a different way from Europe, with, amongst other things, the so called Basal Eurasian component replacing ENF. But for this to happen we'll need at least one ancient genome that is in large-part of Basal Eurasian origin. In any case, that's a whole different subject.

See also...

4mix: four-way mixture modeling in R

Sunday, December 21, 2014

Gokhem2 + Motala12 =/= present-day Swedes


I've seen quite a few comments on this blog suggesting that most of the Ancient North Eurasian (ANE) admixture found in Northern Europe today might come from Scandinavian hunter-gatherers like Motala12 and Ajvide58. It's probably obvious to most that this is not realistic, because the Scandinavian forager genomes sequenced to date show very high ratios of Western European Hunter-Gatherer (WHG) ancestry (>80%), so basically the math doesn't add up.

Nevertheless, I thought it might be useful to drive the point home using this Principal Component Analysis (PCA) based on my new West Eurasia K8 test. The datasheet is available here. You can view a spreadsheet of the results with extra samples here.

Please note that neither Motala12 nor Gokhem2, a late Neolithic farmer from south Sweden belonging to the Funnelbeaker culture, can pass for present-day Swedes. Moreover, mixing Gokhem2 with Motala12, in any proportions, will not produce a result even vaguely similar to present-day Swedes (ie. the outcome will fall somewhere along the dotted line).

I'd say one of the most obvious ways to get the right result would be to blend the Scandinavian forager and farmer with at least one other sample from somewhere below (ie. geographically speaking, east or southeast) of the Swedish cluster.

It might be possible to come up with a more precise plot location, and thus perhaps geographic origin, for this putative third source of Swedish ancestry by running some complex tests with the PCA datasheet. If anyone wants to have a go at that, and you actually manage to come up with a coherent outcome, then feel free to post your findings in the comments below.

I've decided not to bother, because as far as I can see, the options are infinite. What we really need are more genomes from the Swedish late Neolithic/early Bronze Age (LN/EBA), preferably belonging to one of the local spin-offs of the Corded Ware culture, which is thought to have originated in Eastern Europe, to provide more datapoints and help narrow down the options.

On a related note, I'm catching up on some reading this holiday season, and currently going through this book chapter which discusses the upheavals during the LN/EBA in south Scandinavia as seen through its archeology.

Rune Iversen, Beyond the Neolithic transition - the "de-Neolithisation" of south Scandinavia

See also...

Bell Beaker, Corded Ware, EHG and Yamnaya genomes in the fateful triangle

Monday, December 15, 2014

ANE is the primary cause of west to east genetic differentiation within West Eurasia


Here's a Principal Component Analysis (PCA) and an accompanying biplot based on output from an improved version of my ANE K7 ancestry test. Let's call it the West Eurasia K8. This one gives more accurate estimates of Western European Hunter-Gatherer (WHG) and Near Eastern admixture proportions, thanks to the use of new ancient samples.
When rotated accordingly (like here), the results are basically indistinguishable from those I get with genotype data (for instance, see here and here), which suggests that they're correct and based on ancestry proportions that are close to the truth. The Past3 data sheet used to create the PCA is available here. You can view a spreadsheet of the results with extra samples here.

Clearly, ANE is the main agent causing the west to east differentiation in dimension 2. Note that even a small rise in ANE, say, 4-5%, creates significant distance between samples on the PCA plot.

East and South Eurasian admixture has a similar effect, but must be more considerable to make an impact on a West Eurasian-specific PCA like this (and it does with the obvious Volga-Ural outliers, who come from Chuvashia and Tatarstan).

On the other hand, Near Eastern admixture without ANE creates almost the opposite effect. Note, for instance, that Neolithic genomes Stuttgart and NE1 show much higher levels of Near Eastern ancestry than most Europeans, and yet they're amongst the most western samples on the plot.

This suggests that the Near East, and in particular the Caucasus, experienced a significant rush of ANE admixture after early Neolithic farmers left the region for Europe. Alternatively, Caucasus populations may have carried even higher levels of ANE than they do today, before newcomers from the Near East mixed with them. But either way, a lot of ANE arrived in the Near East at some point.

It also suggests that, overall, the populations that moved west across northern Europe after the Neolithic, and shifted northern European genetic structure to the east, did not carry high ratios of Near Eastern ancestry. Instead, they harbored high ratios of ANE and WHG. What these ratios were exactly I haven't a clue, but ancient DNA should tell us that soon.

Below are the ancestry proportions for the five ancient genomes in this analysis, in chronological order. It's interesting to note (yet again) the rising and falling Near Eastern admixture, from the Mesolithic to Neolithic and then from the Neolithic to Bronze Age, respectively, as well as the steady rise of ANE from the Bronze Age to the Iron Age.

Loschbour (Mesolithic)

ANE 0
South_Eurasian 0
Near_Eastern 0
East_Eurasian 0
WHG 99.5
Oceanian 0.5
Pygmy 0
Sub-Saharan 0

Stuttgart (Neolithic)

ANE 0
South_Eurasian 0
Near_Eastern 72.19
East_Eurasian 0
WHG 27.8
Oceanian 0
Pygmy 0
Sub-Saharan 0

NE1 (Neolithic)

ANE 0
South_Eurasian 0
Near_Eastern 69.82
East_Eurasian 0
WHG 30.17
Oceanian 0
Pygmy 0
Sub-Saharan 0

BR2 (Bronze Age)

ANE 9.62
South_Eurasian 0.08
Near_Eastern 43.96
East_Eurasian 0
WHG 45.44
Oceanian 0.48
Pygmy 0.23
Sub-Saharan 0.19

Hinxton4 (Iron Age)

ANE 15.08
South_Eurasian 0.06
Near_Eastern 35.44
East_Eurasian 0.46
WHG 48.5
Oceanian 0
Pygmy 0
Sub-Saharan 0.46

See also...

The fateful triangle

Bell Beaker, Corded Ware, EHG and Yamnaya genomes in the fateful triangle

Sunday, October 26, 2014

Hinxton ancient genomes roundup


Most visitors here are probably aware by now that the Iron Age genomes from Hinxton are the two male samples 1 and 4 (ERS389795 and ERS389798, respectively). You can find confirmation of this at the link below.
The researchers were surprised to find that the older Iron Age men were genetically more similar to people living in Britain today than the Anglo-Saxon women were. Stephan Schiffels of the Wellcome Trust Sanger Institute reported the results October 20 at the annual meeting of the American Society of Human Genetics.

“It doesn’t look like these Anglo-Saxon immigrants left a big impact on the genetic makeup of modern-day Britain,” Schiffels said.

The finding raises an intriguing possibility that indigenous people in Britain may have repelled the Anglo-Saxons but adopted the invaders’ language and culture, says Eimear Kenny, a population geneticist at the Icahn School of Medicine at Mount Sinai in New York City, who was not involved in the work. More ancient samples from other times and parts of Britain should give a clearer picture of that episode of history, she said.

Anglo-Saxons left language, but maybe not genes to modern Britons

In regards to the main thrust of the article above, I'm not sure if there's much point discussing whether the British today are mostly of Celtic or Anglo-Saxon stock based on just five ancient genomes from a single location in England. However, if I was told that Hinxton4, the only high coverage genome in this collection, was a modern sample, I'd say it belonged to an Irishman from western Ireland, rather than an Englishman from eastern England.

Thus, unless Hinxton4 was an ancient migrant from Ireland, then it does seem to me as if there was a fairly significant admixture event in England between the indigenous Irish-like Celts and newcomers from the east, which eventually resulted in the present-day English population.

In any case, there are indeed some noticeable differences between the two sets of samples, and these can be visualized by plotting their f3 shared drift statistics.

For instance, plotting the f3-statistics of Hinxton2, which actually looks like the genome of someone straight off the boat from the Jutland Peninsula, against those of Hinxtons 1 and 4, we see that the former shares most drift with the Danes. Moreover, the Danes, Swedes and Germans, all Germanic speakers of course, deviate strongly on both graphs from the lines of slope that run from the Erzya to the Irish. The reason they deviate from these lines is because they don't share enough drift with Hinxtons 1 and 4 compared to the other reference populations from Northwestern Europe, especially the Irish.


A similar pattern can be seen when plotting the average results of Hinxtons 1 and 4 against those of 2, 3 and 5. However, the effect isn't nearly as pronounced, possibly because Hinxtons 3 and 5 are of mixed Celtic/Germanic origin.


See also...

Analysis of an ancient genome from Hinxton

Analysis of Hinxton2 - ERS389796

Analysis of Hinxton3 - ERS389797

Analysis of Hinxton4 - ERS389798

Analysis of Hinxton5 - ERS389799

Friday, October 24, 2014

Analysis of Hinxton5 - ERS389799


Hinxton5, or ERS389799, is one of five ancient English genomes stored at the Sequence Read Archive under accession number ERP003900. However, this analysis is based on the genotype file of Hinxton5 available at Genetic Genealogy Tools. For more information and some speculation about these genomes see my earlier blog post here.

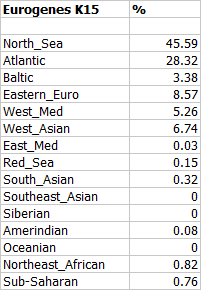
Despite its relatively low North Sea score in the Eurogenes K15, and pronounced western shift on the Principal Component Analysis (PCA) plots, this genome appears mostly Germanic. In my opinion, the shared drift stats and also oracle results are quite convincing in this regard. If this were a modern sample it could probably pass for 3/4 north Dutch and 1/4 Irish. By the way, the Sub-Saharan admixture just looks like noise; this is, after all, a low coverage genome.


Shared drift stats of the form f3(Mbuti;Hinxton5,Test) - Eurogenes dataset

Shared drift stats of the form f3(Mbuti;Hinxton5,Test) - Human Origins dataset


Eurogenes K15 4 Ancestors Oracle results

See also...

Analysis of Hinxton2 - ERS389796

Analysis of Hinxton3 - ERS389797

Analysis of Hinxton4 - ERS389798

Hinxton ancient genomes roundup

Wednesday, October 22, 2014

Ust'-Ishim belongs to K-M526


Not long ago I predicted that Ust'-Ishim belonged to a basal form of Y-chromosome haplogroup P (see here). As it turns out, the 45,000 year-old western Siberian genome belongs to K(xLT) or K-M526, which is actually pretty close to my guess. The Ust'-Ishim paper was published today and is sitting behind a paywall here, but the extensive supp info is free.

Here's a map to help visualize the information, featuring Ust'-Ishim as well as Mal'ta boy, another North Eurasian Upper Paleolithic genome published recently.


The Ust'-Ishim genome was sequenced from the fossil of a femur bone found on the right bank of the Irtysh River. This area is very close to the Urals, and almost in the middle of the former Mammoth steppe that once stretched across North Eurasia from Iberia to Alaska. Interestingly, M526 is an ancestral mutation to the markers that define Y-chromosome haplogroups N, Q and R, which possibly dominated North Eurasia since the Upper Paleolithic (note that the 24,000 year-old Mal'ta boy belongs to a basal form of R).

Moreover, R1a and R1b are the most frequent haplogroups in Europe today. Thus, it would seem that most European males derive their paternal ancestry from North Eurasian hunter-gatherers whose ancestors spread out across Eurasia from the Middle East over 45,000 years ago.

I know that a lot of people have been arguing recently that K-M526 and the derived P-M45 originated and diversified in Southeast Asia, and then migrated north well within the last 45,000 years (for instance, see here). However, considering that K-M526 was already in reindeer country 45,000 years ago, as well as the Denisovan (ancient Siberian hominin) admixture among Southeast Asians, that might well turn out to be the equivalent of arguing that up is down and down is up.

By the way, Ust'-Ishim also belongs to pan-Eurasian mitochondrial (mtDNA) haplogroup R*, and in terms of genome-wide genetic structure appears roughly intermediate between West and East Eurasians. These outcomes fit very nicely with its Y-haplogroup.

However, it's slightly closer to Mesolithic Iberian genome La Brana-1, Upper Paleolithic Siberian MA-1 (or Mal'ta boy), and present-day East Asians, than to present-day West Eurasians, including Europeans. That's because it lacks "ancestry from a population that did not participate in the initial dispersals of modern humans into Europe and Asia". This is obviously the so called Basal Eurasian admixture discussed in Lazaridis et al. (see here), which is probably associated with early Neolithic farmers.

Also worth mentioning is that Ust'-Ishim harbors longer stretches of Neanderthal chromosomal segments than present-day Eurasians, which suggests that admixture between modern humans and Neanderthals took place in the Middle East not long before the ancestors of Ust-Ishim moved into Siberia (50-60,000 years ago). But this was already covered months ago, and you'll find lots of links on the topic on Google.

Citation...

Qiaomei Fu et al., Genome sequence of a 45,000-year-old modern human from western Siberia, Nature 514, 445–449 (23 October 2014) doi:10.1038/nature13810

See also...

Y-haplogroup P1 in Pleistocene Siberia (Sikora et al. 2018 preprint)

Monday, October 20, 2014

Analysis of Hinxton4 - ERS389798


Hinxton4, or ERS389798, is one of five ancient English genomes stored at the Sequence Read Archive under accession number ERP003900. However, this analysis is based on the genotype file of Hinxton4 available at Genetic Genealogy Tools. For more information and some speculation about these genomes see my earlier blog post here.

I still don't know who these samples represent exactly, but in all likelihood, this is one of the two Iron Age sequences from the collection, and probably belongs to a Briton of Celtic stock. Note, for instance, its high affinity to the present-day Irish, relatively low North Sea score in the Eurogenes K15, and pronounced western shift on the second Principal Component Analysis (PCA) plot below.

Interestingly, Lithuanians top its shared drift list based on the Human Origins dataset and more than 360K SNPs. I'm not entirely sure what this means, but it's probably related in some way to the unusually high level (>45%) of indigenous European hunter-gatherer ancestry carried by Lithuanians.


Shared drift stats of the form f3(Mbuti;Hinxton4,Test) - Eurogenes dataset

Shared drift stats of the form f3(Mbuti;Hinxton4,Test) - Human Origins dataset


Eurogenes K15 4 Ancestors Oracle results

See also...

Analysis of Hinxton2 - ERS389796

Analysis of Hinxton3 - ERS389797

Analysis of Hinxton5 - ERS389799

Hinxton ancient genomes roundup

Friday, October 17, 2014

Analysis of Hinxton3 - ERS389797


Hinxton3, or ERS389797, is one of five ancient English genomes stored at the Sequence Read Archive under accession number ERP003900. However, this analysis is based on the genotype file of Hinxton3 available at Genetic Genealogy Tools. For more information and some speculation about these genomes see my earlier blog post here.

Despite the exaggerated North Sea score in the Eurogenes K15, Hinxton3 could easily pass for a present-day Briton from the eastern coast of England or Scotland, albeit with a stronger than usual pull towards Scandinavia. Indeed, the f3-statistics show that it shares most genetic drift with the British and Icelanders from Eurogenes and Human Origins, respectively.


Shared drift stats of the form f3(Mbuti;Hinxton3,Test) - Eurogenes dataset

Shared drift stats of the form f3(Mbuti;Hinxton3,Test) - Human Origins dataset


Eurogenes K15 4 Ancestors Oracle results

See also...

Analysis of Hinxton2 - ERS389796

Analysis of Hinxton4 - ERS389798

Analysis of Hinxton5 - ERS389799

Hinxton ancient genomes roundup

Analysis of Hinxton2 - ERS389796


Hinxton2, or ERS389796, is one of five ancient English genomes stored at the Sequence Read Archive under accession number ERP003900. However, this analysis is based on the genotype file of Hinxton2 available at Genetic Genealogy Tools. For more information and some speculation about these genomes see my earlier blog post here.

Interestingly, f3-statistics in the form f3(Mbuti;Hinxton2,Test) show that Hinxton2 shares most genetic drift with present-day Danes and Norwegians. Please refer to the relevant spreadsheets below.


Shared drift stats of the form f3(Mbuti;Hinxton2,Test) - Eurogenes dataset

Shared drift stats of the form f3(Mbuti;Hinxton2,Test) - Human Origins dataset


Eurogenes K15 4 Ancestors Oracle results

See also...

Analysis of Hinxton3 - ERS389797

Analysis of Hinxton4 - ERS389798

Analysis of Hinxton5 - ERS389799

Hinxton ancient genomes roundup

Sunday, October 12, 2014

Ancient genomes and the calculator effect


Several ancient genomes have been posted online as text files and uploaded to GEDmatch over the last couple of weeks, and many more are likely to follow in the future. A lot of people have already taken this opportunity to analyze these files with various online ancestry tools, usually DIY calculators.

That's actually not a bad way of doing things, as long as everyone's aware that almost all of these calculators produce biased results. They produce biased results because they violate a very basic rule of science, which is this:
Do not test more than one variable at a time.
Obviously, the variable we want to test with these calculators is ancestry. However, when the reference samples are tested in a different way to the test samples, which is what usually happens, then this adds another variable to the proceedings. As a result, we simply can't compare the results of the reference samples to those of the test samples.

I know that a lot of people find this difficult to grasp, and many just seem hell bent on not grasping it. However, anyone who isn't completely insane, and takes five minutes out of their day to try and understand the concepts involved, has to agree that this is a real problem. It can be proven empirically, like I did over two years ago (see here).

I suspect that a lot of confusion has been caused by the fact that the people who were used as reference samples in the making of the various DIY calculators saw highly accurate results when running them, and so assumed everything was fine. The accuracy of the DIY calculators for such people is indeed impressive, and I show that at the link above, but unfortunately the story is very different for everyone else.

Here's the good news: the Eurogenes calculators don't suffer from the calculator effect. That's because the reference samples are treated in the same way as the test samples, so there's only one variable: ancestry. What this means is that when you run a modern or ancient genome with a Eurogenes calculator you can confidently compare the result to those of the reference samples (provided enough SNPs are used), and then be able to make sensible inferences about its genetic origins.

Wednesday, October 8, 2014

Analysis of an ancient genome from Hinxton


I've just added an ancient sample from Hinxton, England, to my burgeoning ancient genomes collection. It's a pre-publication release freely available here as ERS389795. Thanks to Felix C. for breaking the news. We've both called this sample Hinxton1.

Unfortunately, its archeological context is a mystery to me, but it's possibly one of the ancient genomes mentioned in the recent Schiffels et al. ASHG abstract (see here).

In terms of genome-wide genetic structure, Hinxton1 is most similar to present-day Orcadians, Irish, western Scots, Icelanders and western Norwegians, more or less in that order. However, it's fairly distinct from the modern inhabitants of England, or at least those in my datasets, who mostly come from Kent and Cornwall.

Please note, this analysis features two different datasets: Eurogenes and Human Origins. Eurogenes, which is my own dataset, includes more populations than Human Origins, and is based on SNPs used in commercial ancestry and medical work. On the other hand, Human Origins shows a more varied sampling strategy, and is based on SNPs specifically chosen for population genetics.


Shared drift stats in the form f3(Mbuti;Hinxton1,Test) - Eurogenes dataset

Shared drift stats in the form f3(Mbuti;Hinxton1,Test) - Human Origins dataset


Eurogenes K15 4 Ancestors Oracle results

See also...

Analysis of Hinxton2 - ERS389796

Analysis of Hinxton3 - ERS389797

Analysis of Hinxton4 - ERS389798

Analysis of Hinxton5 - ERS389799

Hinxton ancient genomes roundup

Wednesday, August 6, 2014

Haplotype-based PCA of West Eurasia and Europe


The Principal Component Analyses (PCA) below are based on pairwise Identity-by-Descent (IBD) sharing inferred with fastIBD. My aim was to create PCA that took into account haplotype information to see how they might differ from similar plots based on unlinked loci (such as here).


Clearly, they're less reflective of geography and isolation-by-distance, and instead more profoundly influenced by relatively recent isolation, founder effects and/or rapid expansions, especially in Northern and Eastern Europe, and in particular among the Finns, Balts and East Slavs. Unfortunately, I don't have time to say much more about these results. But feel free to post any questions or observations in the comments below. I have done something very similar in the past, but with far fewer samples (see here).

Please note, to ensure that the PCA were as informative as possible I was forced to drop several populations that produced unusual results, probably because of extreme founder effects. This is why, for instance, there are no Ashkenazi Jews on any of the plots, and the only Finns you'll find come from western Finland.

I'll try this again on a much larger dataset when more samples come in, and also include populations from Central and South Asia.

Update 7/8/2014: Apparently some people are wondering what the plots with Finns and Jews look like. Here you go...


Tuesday, May 13, 2014

PCA projection bias in ancient DNA studies


Many Principal Component Analyses (PCA) in papers on ancient genomes clearly suffer from projection bias. However, most people don't seem to understand this problem and the impact it can have on the interpretation of data.

Here's a demonstration of this effect using two PCA. In the first PCA, La Brana-1, a Mesolithic genome from Iberia, was projected onto the PC eigenvectors computed with modern individuals from the HGDP. However, in the second PCA the ancient genome was run together with these samples. Note the clear difference between the two outcomes.


The second outcome does look a bit strange, but it's actually the correct one, because it's now an established fact that Mesolithic hunter-gatherers, like La Brana-1, were clearly outside the range of modern European, and indeed West Eurasian, genetic variation.

For a technical discussion of this problem, which is also sometimes known as "shrinkage", refer to Lee et al. 2012.

The above experiment with La Brana-1 was run with PLINK 2, which is freely available here, using just over 16K SNPs. Only markers with a read depth of 4x or higher were considered, and the marker set was further pruned to account for no-calls (--geno 0.005), LD (--indep-pairwise 200 25 0.4), and minor allele frequency (--maf 0.05).

Thursday, April 3, 2014

The really old Europe is mostly in Eastern Europe


A new version of the Lazaridis et al. ancient genomes preprint has just appeared at arXiv (see here). It includes several new Principal Component Analyses (PCA), TreeMix graphs, a ChromoPainter/fineSTRUCTURE co-ancestry matrix, and an updated ADMIXTURE analysis. The revised text underlines the relatively close genetic relationship between indigenous European hunter-gatherers and present-day Eastern Europeans:


The co-ancestry matrix (Fig. S19.3) confirms the ability of this method to meaningfully cluster individuals. We highlight two clusters: Stuttgart joins all Sardinian individuals in cluster A and Loschbour joins a cluster B that encompasses all Belarusian, Ukrainian, Mordovian, Russian, Estonian, Finnish, and Lithuanian individuals. These results confirm Sardinia as a refuge area where ancestry related to Early European Farmers has been best preserved, and also the greater persistence of WHG-related ancestry in present-day Eastern European populations. The latter finding suggests that West European Hunter-Gatherers (so-named because of the prevalence of Loschbour and La Braña) or populations related to them have contributed to the ancestry of present-day Eastern European groups. Additional research is needed to determine the distribution of WHG-related populations in ancient Europe.


Fig. S10.5 suggests that the main axis of differentiation in Europe when the subcontinent is considered as a whole may tend to Northeastern Europe rather than SSE/NNW (8). This is consistent with our analysis of ancestry proportions in European populations (Fig. 2B, Extended Data Table 3) which indicate a cline of reduced EEF (and increasing WHG) ancestry along that direction.

Citation...

Iosif Lazaridis, Nick Patterson, Alissa Mittnik, et al., Ancient human genomes suggest three ancestral populations for present-day Europeans, arXiv, April 2, 2014, arXiv:1312.6639v2

Wednesday, January 8, 2014

Another look at the Lazaridis et al. ancient genomes preprint


I've now had a chance to look over the Lazaridis et al. preprint a few times, and also take part in several online discussions about the results, at these blogs and elsewhere. So I thought it might be useful to put together another post on the paper to report what I've learned and reiterate a few points. First of all, to understand the results, it's really important to known what the four main ancestral components in this study represent:

- West European Hunter-Gatherer (WHG), based on an 8,000 year-old genome from Loschbour, Luxembourg

- Ancient North Eurasian (ANE), based on a 24,000 year-old genome from South Siberia (dubbed Mal'ta boy or MA-1)

- Early European Farmer (EEF), based on a 7,500 year-old genome from Stuttgart, Germany, belonging to the Neolithic Linearbandkeramik (LBK) culture

- Eastern non-African (ENA), this basically means East Eurasian, and is based on samples of present-day Onge, Han Chinese and Atayal from Taiwan

Now, from what I've seen online, many people seem to think that ANE is more East Asian than European, and can be considered a signal of pretty much any population expansion from the east into Europe. This is not true. ANE is Amerindian-like, but actually also very similar to WHG. In fact, they're equidistant from ENA:

The results of Table S12.1 provide suggestive evidence that Onge share more common ancestry with hunter-gatherers than with Stuttgart. All statistics involving two hunter-gatherer populations have |Z|<0.9, so ancient Eurasian hunter-gatherers are approximately symmetrically related to Onge, and they are all more closely related to them than is Stuttgart.

We next consider the relationship of ancient samples to East Asia using the set (Ami, Atayal, Han, Naxi, She). East Asians are more closely related to all hunter-gatherers than to Stuttgart, but there are no significant differences between hunter-gatherers (all such statistics have |Z|<1.1) (Table S12.2).

...

We have conveniently labeled MA1-related ancestry “Ancient North Eurasian” because of the provenance of MA1 in Siberia, but at present we cannot be sure whether this type of ancestry originated there or was a recent migrant from some western region.

The various Uralic, Turkic and Mongolian groups expanding into Europe, usually after the Bronze Age, no doubt carried significant ENA, so these groups can't be the source of the fairly high levels of ANE across Europe today, because most Europeans lack ENA. Below is a graph based on two f4 tests, comparing ANE and ENA ancestry among Europeans, this time with the Han Chinese as ENA proxies. Note that most of the samples fall within a cline that runs from the Stuttgart sample to Estonians. The only outliers in the direction of the Han are groups from current or former Uralic and Turkic speaking areas of Europe.


ANE was actually present in Scandinavia during the Mesolithic, because Motala12, the 8,000 year-old hunter-gatherer genome from Sweden, has an ANE ratio of 19%. But this isn't enough to explain the ANE levels carried by most present-day Europeans, so it's very likely there were at least two expansions of ANE into Europe.

Considering that Loschbour and Stuttgart totally lack ANE, it's plausible that a major wave of ANE moved across much of Europe sometime after the early Neolithic, but obviously before the Uralic and Turkic expansions, which, as per above, were rich in ENA. Based on recently published ancient mtDNA evidence from Central Europe (see here), Lazaridis et al. propose that this timeframe was the Copper and/or Bronze Age.

This of course is the generally accepted Proto-Indo-European timeframe. Indeed, the theory I put forward in the previous blog entry (see here) that most of the ANE in Europe today was the result of the Proto-Indo-European expansion, probably from Eastern Europe, looks even better on closer inspection.

Note the elongated cline formed by the European samples running from WHG to EEF on Fig 2B, shown below. It correlates well with latitude, and very likely reflects northward migrations of Neolithic farmers into Europe from the Mediterranean Basin, followed by isolation-by-distance. In other words, this cline probably took thousands of years to form.


On the other hand, there is no cline running from WHG/EEF to ANE, but all of the Indo-European and/or Eastern European samples are fairly evenly lifted up towards ANE relative to a few outliers. These outliers are all southwestern Europeans: Basques, Pais Vasco (Basque Country) Spaniards, southern French and Sardinians.

Of course, southwestern Europe is the most distant part of the continent from the generally accepted Indo-European homeland near the middle Volga. Moreover, Basques don't speak an Indo-European language, while Sardinians were only Indo-Europeanized during historic times.

Indeed, even though a couple of tables in the study report considerable ANE ancestry among Basques and Pais Vasco Spaniards, the authors admit that this need not be the case. For instance:

We next attempted to fit individual West Eurasian populations as a mixture of Loschbour and Stuttgart, as representatives of Early European farmers and West European Hunter Gatherers.

Fig. 1B suggests that this is not possible, as most Europeans form a cline that cannot be reconciled with such a mixture [Davidski's note: I think they actually mean Fig. 2B]. Nonetheless, for Sardinians (Extended Data Table 1), the most negative f3-statistic is of the form f3(Test; Loschbour, Stuttgart), which suggests that at least some Europeans may be consistent with having been formed by such a mixture. We thus fit each European population into the topology of Fig. S12.6. Only Basques, Pais_Vasco, and Sardinians, can be fit successfully with this model. Fig. S12.8 shows a successful fit.

Most European populations cannot be fit as this type of 2-way mixture and, intuitively, this is due to their tendency (Fig. 1B) towards Ancient North Eurasians that is not modeled by such a mixture.

Another intriguing thing about the results shown in Fig 2B is that the expansions of ANE across Europe appear not to have disturbed the presumably Neolithic WHG/EEF cline to any great extent. What this suggests is that ANE was spread largely independently of EEF and even WHG. In other words, the groups that pushed ANE deep into Europe probably had very high ratios of this component. This also seems to be true for the groups that brought ANE to the Near East:

A geographically parsimonious hypothesis would be that a major component of present-day European ancestry was formed in eastern Europe or western Siberia where western and eastern hunter-gatherer groups could plausibly have intermixed. Motala12 has an estimated WHG/(WHG+ANE) ratio of 81% (S12.7), higher than that estimated for the population contributing to modern Europeans (Fig. S12.14). Motala and Mal’ta are separated by 5,000km in space and about 17 thousand years in time, leaving ample room for a genetically intermediate population. The lack of WHG ancestry in the Near East (Extended Data Fig. 6, Fig. 1B) together with the presence of ANE ancestry there (Table S12.12) suggests that the population who contributed ANE ancestry there may have lacked substantial amounts of WHG ancestry, and thus have a much lower (or even zero) WHG/(WHG+ANE) ratio.

So perhaps the 17,000 year-old Afontova Gora 2 (AG2) genome from Central Siberia, classified as part of the ANE meta-population by Lazaridis et al., is genetically the closest sample we have to the Proto-Indo-Europeans? Based on a couple of the PCA from Lazaridis et al. (below) and Raghavan et al. (see here), this genome doesn't appear to be 100% ANE. My very rough estimate is 85/15 ANE/WHG.


If my assumptions are correct here, then it's no wonder that this Bronze Age Danish sample (M4) from the recent Carpenter et al. paper (see here) shows a clear shift towards the Americans on the global PCA. M4 is better known as "the old man" from the giant Borum Eshøj barrow (see here), presumably built by some of the earliest Indo-Europeans in Scandinavia. We can probably expect such Afontova Gora 2-like results from many European samples archeologically linked to the early Indo-Europeans.


There also have been a lot of comments online about the potential correlations between ANE and certain clusters generated from modern samples with the ADMIXTURE software. I think it's obvious from just looking at the ADMIXTURE bar graph from Lazaridis et al. that ANE is linked in one way or another to the clusters that peak in Northeastern Europe, the North Caucasus, and South Central Asia (especially among the Indo-Iranian Kalash).

Below is the bar graph from the optimal ADMIXTURE run, the K=16. Note that ANE proxy MA-1 mostly shows membership in the cream and light blue clusters, which peak among the Kalash and Lithuanians, respectively. Click on the image to enlarge.


The Kalash-centered cluster, which actually first appears at K=14, and is more or less repeated in four runs, is particularly interesting, because it shows fairly similar distribution patterns to ANE. Note, for instance, that after South Central Asia it reaches its highest levels in the North Caucasus, which is where ANE also shows a major peak today (see here). Moreover, in Europe it's most pronounced in the east and north, but appears at comparatively trivial levels among the Basques, southern French and Pais Vasco Spaniards, and doesn't show up at all among Sardinians or the ancient European genomes.

However, it's often very difficult to make inferences about ancient population movements from ADMIXTURE results, and I think this is one of those cases. Just because this cluster peaks among the Kalash, doesn't mean that it has its origins within this group, or even in Asia. I'd say the most plausible explanation for its existence is that it represents ANE that expanded rapidly across Eurasia, probably during the early Indo-European dispersals, and today reaches its higher frequencies among some of the most isolated and genetically drifted recipients of this ANE gene flow (ie. those in the Caucasus and Hindu Kush).

By the way, the difference in ANE levels between southwestern Europeans and most other West Eurasians clearly shows on my own PCA and MDS maps. Below is the latest Eurogenes PCA of West Eurasia from a few months ago. Note the pronounced eastern shift among almost all the samples relative to the Basques, Pais Vasco Spaniards, and Sardinians. As per the f4 graph above, only in some instances is this shift also the result of significant ENA ancestry.


It's incredible what a few ancient genomes can add to the context of these sorts of analyses using modern DNA. I didn't really know what was causing this eastern shift when I posted the PCA, and guessed that it might simply be a lack of Mediterranean ancestry across Northern and Eastern Europe (see here).

I also just noticed that Razib posted two articles on the pigmentation traits of the ancient individuals (see here and here). The sample is tiny, but looking back, the fact that the Loschbour hunter-gatherer probably had blue eyes and dark skin, while, on the other hand, the Stuttgart farmer had relatively light skin, is actually quite remarkable.

We'll have a major story on our hands if several other hunter-gatherer genomes come back with similar results. It's just not something anyone would've predicted from modern DNA. Apart from that, there's also the slight shock factor of learning that our not too distant indigenous European ancestors were probably of a deep shade of brown. Imagine that, Europe might have only really lightened up and become white after Near Eastern migrants made their way over. Well, let's wait and see.

Citation...

Iosif Lazaridis, Nick Patterson, Alissa Mittnik, et al., Ancient human genomes suggest three ancestral populations for present-day Europeans, bioRxiv, Posted December 23, 2013, doi: 10.1101/001552

Raghavan et al., Upper Palaeolithic Siberian genome reveals dual ancestry of Native Americans, Nature, (2013), Published online 20 November 2013, doi:10.1038/nature12736

Carpenter et al., Pulling out the 1%: Whole-Genome Capture for the Targeted Enrichment of Ancient DNA Sequencing Libraries, The American Journal of Human Genetics (2013), https://dx.doi.org/10.1016/j.ajhg.2013.10.002

See also...

Ancient human genomes suggest (more than) three ancestral populations for present-day Europeans

The really old Europe is mostly in Eastern Europe

EEF-WHG-ANE test for Europeans