In a
recent paper about complex traits in Europeans, Marnetto et al. found that blond hair and blue eyes showed a relatively high association with ancient Anatolian ancestry.
This is a somewhat curious finding considering that ancient Anatolians weren't particularly blond haired or blued eyed, and that's probably an understatement.
However, the Europeans that Marnetto et al. based their analysis on were Estonians. And in Estonia ancient Anatolian ancestry peaks in the west and north, probably because this is where Estonians have the most Germanic and Finnish ancestry.

Germanic and Finnish populations are somewhat richer in ancient Anatolian ancestry than Estonians, and, unlike ancient Anatolians, they're often exceptionally blond haired and blue eyed.
So it makes sense that, in Estonia at least, ancient Anatolian ancestry is associated with blond hair and blue eyes, but only indirectly so. The more direct link is between Germanic and Finnish ancestry and blond hair and blue eyes.
I feel that Marnetto et al. should've investigated this, and they also should've made it clear that the associations they found won't necessarily be seen in other European countries.
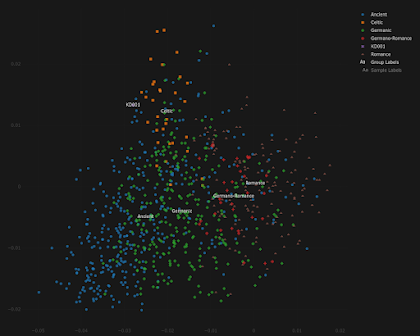
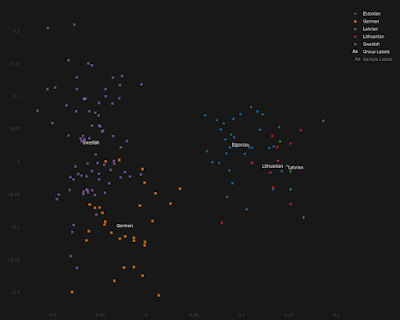
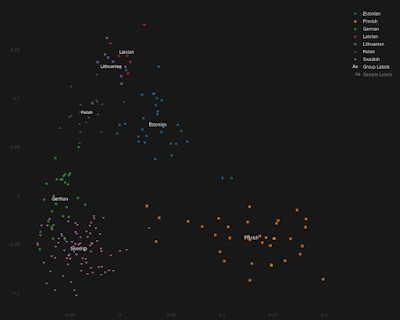
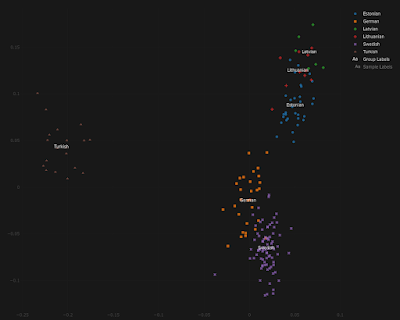
For the doubters out there, and I know there are at least a few of you, below is a series of Principal Component Analyses (PCA) showing how Estonians compare to other populations from around the Baltic Sea, as well as to present-day Turks from central Anatolia.
Note that, by and large, the same Estonians who show more affinity to the Germanic and/or Finnish individuals are also shifted slightly closer to the Turks, and this is because they harbor elevated ancient Anatolian ancestry. The relevant datasheets are available
here.
Citation...
Marnetto et al.,
Ancestral genomic contributions to complex traits in contemporary Europeans,
Current Biology (2022), https://doi.org/10.1016/j.cub.2022.01.046
See also...
Ancient ancestry and complex traits in Estonians (Marnetto et al. 2022)
Mainstream media BS: Europeans owe their height to Asian nomads