Showing posts with label Northwestern Europe. Show all posts
Showing posts with label Northwestern Europe. Show all posts
Monday, February 21, 2022
The Pict
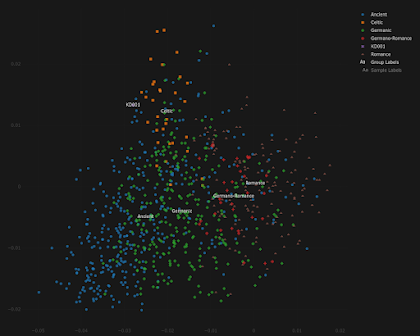
KD001 is the first undeniable Pictish sample in my dataset, courtesy of Dulias et al. 2022. Thanks to Altvred for processing the files.
This is how KD001 behaves in my Celtic vs Germanic Principal Component Analysis (PCA). Looks kind of Irish, doesn't he?
To see an interactive version of the plot, paste the coordinates from here into the relevant field here.
See also...
Celtic vs Germanic Europe
Avalon vs Valhalla revisited
When did Celtic languages arrive in Britain?

Sunday, January 17, 2021
That old chestnut: Northeast vs Northwest Euros
In the last comment thread reader Greg put forth this question:
David, when are you going to explain the genetic discrepancy between Northeastern and Northwestern Europeans? You know, the one that people believe is due to Baltic Hunter-Gatherer admixture, whereas you believe it is due to genetic drift? You ought to make a post about this issue at some point, because a lot of people are wondering what's causing the differences.Well, Greg, this issue has been discussed to the proverbial death here and elsewhere. In fact, there were two posts and rather lengthy comment threads on the same topic at this blog just a few months ago. See here and here. Nevertheless, it seems that a fair number of people are still befuddled, so I'm going to try to explain this one last time, as briefly as a I can using just a handful of f4-stats. Admittedly, Northeast Europeans generally do pack higher levels of indigenous European hunter-gatherer ancestry than Northwest Europeans. This is especially true of Balts, who show more of this type of ancestry than even Scandinavians in practically every type of analysis. The f4-stats below back this up unambiguously. Note the significantly positive (>3) Z scores, which suggest that Latvians and Lithuanians harbor more Baltic hunter-gatherer-related ancestry than Norwegians and Swedes.
Chimp Baltic_HG Norwegian Latvian 0.001301 7.114 Chimp Baltic_HG Swedish Latvian 0.001017 4.205 Chimp Baltic_HG Norwegian Lithuanian 0.001023 7.341 Chimp Baltic_HG Swedish Lithuanian 0.000763 3.408Greg, I know what you're thinking: the naysayers are right! But wait, because there's a twist to this tale. Check out these f4-stats:
Chimp Baltic_HG Norwegian Belarusian 0.000265 1.934 Chimp Baltic_HG Swedish Belarusian 0.000152 0.7 Chimp Baltic_HG Norwegian Polish 6.4E-05 0.519 Chimp Baltic_HG Swedish Polish -0.000235 -1.074Please note, Greg, that none of the Z scores reach significance, which means that these Northwest Europeans and Slavs are symmetrically related to Baltic_HG. They're also symmetrically related to other relevant ancient groups such as the Yamnaya steppe herders. This, of course, suggests that they harbor very similar levels of basically the same ancient genetic components.
Chimp Karelia_HG Norwegian Belarusian 0.000136 0.844 Chimp Karelia_HG Swedish Belarusian 7.9E-05 0.32 Chimp Karelia_HG Norwegian Polish -4.7E-05 -0.304 Chimp Karelia_HG Swedish Polish -0.000134 -0.54 Chimp Yamnaya_Samara Norwegian Belarusian -0.000134 -1.085 Chimp Yamnaya_Samara Swedish Belarusian -6.6E-05 -0.34 Chimp Yamnaya_Samara Norwegian Polish -0.000225 -1.995 Chimp Yamnaya_Samara Swedish Polish -0.000311 -1.574 Chimp Barcin_N Norwegian Belarusian -0.000335 -2.809 Chimp Barcin_N Swedish Belarusian -0.000284 -1.491 Chimp Barcin_N Norwegian Polish -0.000222 -2.057 Chimp Barcin_N Swedish Polish -0.000318 -1.662 Chimp Baikal_N Norwegian Belarusian 0.000186 1.3 Chimp Baikal_N Swedish Belarusian -7E-05 -0.33 Chimp Baikal_N Norwegian Polish -4.6E-05 -0.351 Chimp Baikal_N Swedish Polish -0.000477 -2.277Interestingly, pairing up Ukrainians with English samples from Cornwall and Kent produces similar outcomes. But that's because most ancient ancestry proportions in Europe show a closer correlation with latitude than longitude.
Chimp Baltic_HG English_Cornwall Ukrainian 0.000282 2.242 Chimp Baltic_HG English_Kent Ukrainian 0.000225 1.748 Chimp Karelia_HG English_Cornwall Ukrainian 0.000323 2.175 Chimp Karelia_HG English_Kent Ukrainian 0.000239 1.634 Chimp Yamnaya_Samara English_Cornwall Ukrainian -6.6E-05 -0.569 Chimp Yamnaya_Samara English_Kent Ukrainian -0.000112 -0.977 Chimp Barcin_N English_Cornwall Ukrainian -0.000519 -4.641 Chimp Barcin_N English_Kent Ukrainian -0.000598 -5.232 Chimp Baikal_N English_Cornwall Ukrainian 0.000385 2.874 Chimp Baikal_N English_Kent Ukrainian 0.00036 2.836Now, Greg, if at least in terms of genetic ancestry, Latvians, Lithuanians, Belarusians, Poles and Ukrainians all qualify as Northeast Europeans, then what makes them different, as a group, from Northwest Europeans? Do you believe that the key factor is admixture from Baltic hunter-gatherers? Or is it genetic drift? Of course, considering all of the f4-stats above, logic dictates that it must be relatively recent genetic drift. Keep in mind, however, that this only applies to Balto-Slavic speaking Northeast Europeans without significant Uralian ancestry. Overall, Uralic speakers have a more complex population history, and indeed genetic differences between them and Northwest Europeans are in large part due to somewhat different ancestry proportions and also Siberian admixture. See also... So who's the most (indigenous) European of us all?
Saturday, December 14, 2019
Avalon vs Valhalla revisited
Pictured below is a new version of my Celtic vs Germanic genetic map. It's based on the same Principal Component Analysis (PCA) as the original (which can be seen here), but more focused on Northwestern Europe and produced with a different program.
 To see the interactive online version, navigate to Vahaduo Custom PCA and copy paste the text from here into the empty space under the PCA DATA tab. Then press the PLOT PCA button under the PCA PLOT tab. For more guidance, refer to the screen caps here and here.
To include a wider range of populations in the key, just edit the data accordingly. For instance, to break up the ancient grouping into more specific populations, delete the Ancient: prefix in all of the relevant rows. This is what you should see:
To see the interactive online version, navigate to Vahaduo Custom PCA and copy paste the text from here into the empty space under the PCA DATA tab. Then press the PLOT PCA button under the PCA PLOT tab. For more guidance, refer to the screen caps here and here.
To include a wider range of populations in the key, just edit the data accordingly. For instance, to break up the ancient grouping into more specific populations, delete the Ancient: prefix in all of the relevant rows. This is what you should see:
 Conversely, you can leave the ancient sample set intact and instead reorder the present-day linguistic groupings into, say, geographic groupings. To achieve this just delete all of the linguistic prefixes, such as Celtic:, Germanic:, and so on. You should end up with a datasheet like this and plot like this.
Of course, you can design your own plot by using any combination of the ancient and present-day individuals and populations that I've already run in this PCA. Their coordinates are listed here. Indeed, if you're in the possession of your own Celtic vs Germanic PCA coordinates, you can add yourself to the plot. And if you're not, see here.
It's also possible to re-process PCA data via the SOURCE tab. But I don't recommend doing this with the Celtic vs Germanic data, which are derived from a fine scale analysis and don't pack much variation. On the other hand, Global25 data are ideal for such re-processing. I made the plots below from subsets of Global25 coordinates available in a zip file here. To see how, refer to the screen caps here and here.
Conversely, you can leave the ancient sample set intact and instead reorder the present-day linguistic groupings into, say, geographic groupings. To achieve this just delete all of the linguistic prefixes, such as Celtic:, Germanic:, and so on. You should end up with a datasheet like this and plot like this.
Of course, you can design your own plot by using any combination of the ancient and present-day individuals and populations that I've already run in this PCA. Their coordinates are listed here. Indeed, if you're in the possession of your own Celtic vs Germanic PCA coordinates, you can add yourself to the plot. And if you're not, see here.
It's also possible to re-process PCA data via the SOURCE tab. But I don't recommend doing this with the Celtic vs Germanic data, which are derived from a fine scale analysis and don't pack much variation. On the other hand, Global25 data are ideal for such re-processing. I made the plots below from subsets of Global25 coordinates available in a zip file here. To see how, refer to the screen caps here and here.


 See also...
Modeling your ancestry has never been easier
Getting the most out of the Global25
Modeling genetic ancestry with Davidski: step by step
See also...
Modeling your ancestry has never been easier
Getting the most out of the Global25
Modeling genetic ancestry with Davidski: step by step


Sunday, September 16, 2018
Celtic vs Germanic Europe
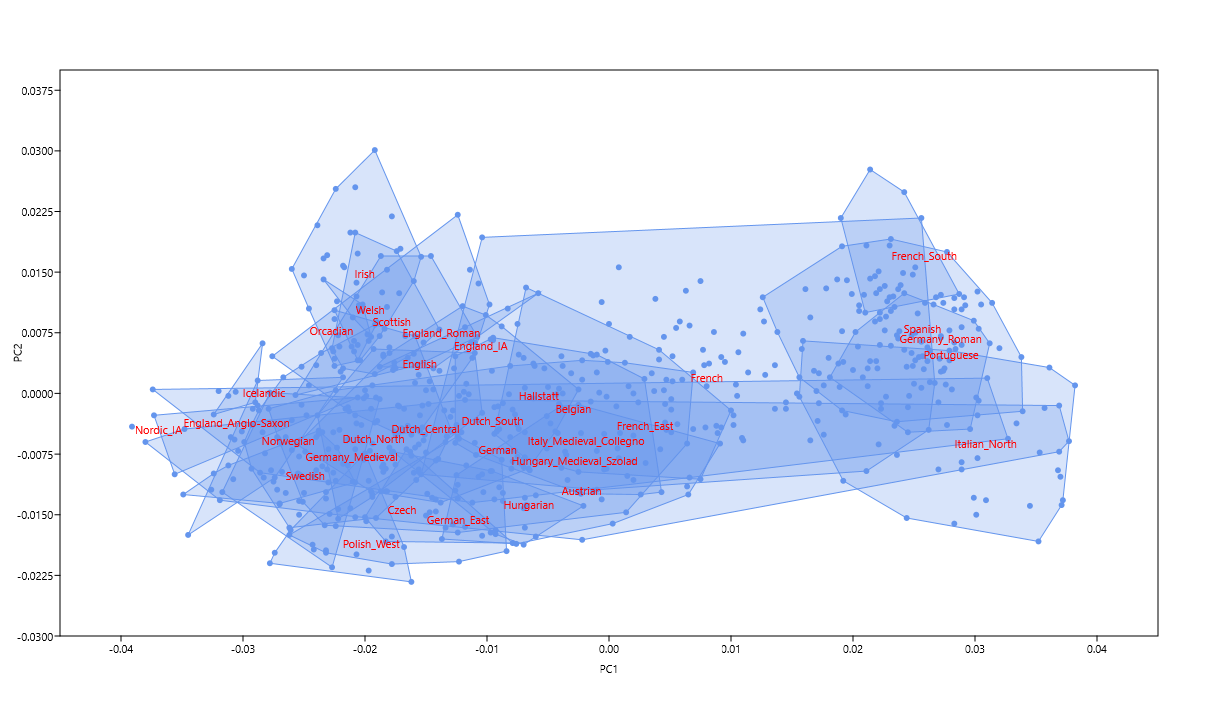
I have a feeling that ancient DNA from post-Bronze Age Northwestern Europe will be coming thick and fast from now on. To get the most out of such data I've designed a new Principal Component Analysis (PCA) that does a better job of separating the Celtic- and Germanic-speaking populations of Europe than my previous efforts of this sort (see here and here). Below are two different versions of the same PCA. The relevant datasheet is available here.

 And here's a Discrimination Analysis (LDA) plot based on the 25 principal components. It further differentiates many of the populations along the east > west cline of genetic diversity.
 The difference between the Germanic Anglo-Saxons and the Celtic and Roman Britons of what is now eastern England is obvious. The Anglo-Saxons could pass for Scandinavians, while the Celts and Romans both cluster between the Irish and French. This makes good sense, and is exactly what I was looking for. It's also interesting to see the presumably Celtic-speaking Hallstatt samples from Bylany, Czechia, clustering with the Belgians.
Update 14/12/2019: Pictured below is a new version of my Celtic vs Germanic genetic map. It's based on the same Principal Component Analysis (PCA) as the original, but more focused on Northwestern Europe and produced with a different program.
To see the interactive online version, navigate to Vahaduo Custom PCA and copy paste the text from here into the empty space under the PCA DATA tab. Then press the PLOT PCA button under the PCA PLOT tab. For more guidance, refer to the screen caps here and here.
To include a wider range of populations in the key, just edit the data accordingly. For instance, to break up the ancient grouping into more specific populations, delete the Ancient: prefix in all of the relevant rows. This is what you should see:
Conversely, you can leave the ancient sample set intact and instead reorder the present-day linguistic groupings into, say, geographic groupings. To achieve this just delete all of the linguistic prefixes, such as Celtic:, Germanic:, and so on. You should end up with a datasheet like this and plot like this.
Of course, you can design your own plot by using any combination of the ancient and present-day individuals and populations that I've already run in this PCA. Their coordinates are listed here. Indeed, if you're in the possession of your own Celtic vs Germanic PCA coordinates, you can add yourself to the plot. And if you're not, see here.
It's also possible to re-process PCA data via the SOURCE tab. But I don't recommend doing this with the Celtic vs Germanic data, which are derived from a fine scale analysis and don't pack much variation. On the other hand, Global25 data are ideal for such re-processing. I made the plots below from subsets of Global25 coordinates available in a zip file here. To see how, refer to the screen caps here and here.
See also...
Modeling your ancestry has never been easier
Getting the most out of the Global25
Modeling genetic ancestry with Davidski: step by step
The difference between the Germanic Anglo-Saxons and the Celtic and Roman Britons of what is now eastern England is obvious. The Anglo-Saxons could pass for Scandinavians, while the Celts and Romans both cluster between the Irish and French. This makes good sense, and is exactly what I was looking for. It's also interesting to see the presumably Celtic-speaking Hallstatt samples from Bylany, Czechia, clustering with the Belgians.
Update 14/12/2019: Pictured below is a new version of my Celtic vs Germanic genetic map. It's based on the same Principal Component Analysis (PCA) as the original, but more focused on Northwestern Europe and produced with a different program.
To see the interactive online version, navigate to Vahaduo Custom PCA and copy paste the text from here into the empty space under the PCA DATA tab. Then press the PLOT PCA button under the PCA PLOT tab. For more guidance, refer to the screen caps here and here.
To include a wider range of populations in the key, just edit the data accordingly. For instance, to break up the ancient grouping into more specific populations, delete the Ancient: prefix in all of the relevant rows. This is what you should see:
Conversely, you can leave the ancient sample set intact and instead reorder the present-day linguistic groupings into, say, geographic groupings. To achieve this just delete all of the linguistic prefixes, such as Celtic:, Germanic:, and so on. You should end up with a datasheet like this and plot like this.
Of course, you can design your own plot by using any combination of the ancient and present-day individuals and populations that I've already run in this PCA. Their coordinates are listed here. Indeed, if you're in the possession of your own Celtic vs Germanic PCA coordinates, you can add yourself to the plot. And if you're not, see here.
It's also possible to re-process PCA data via the SOURCE tab. But I don't recommend doing this with the Celtic vs Germanic data, which are derived from a fine scale analysis and don't pack much variation. On the other hand, Global25 data are ideal for such re-processing. I made the plots below from subsets of Global25 coordinates available in a zip file here. To see how, refer to the screen caps here and here.
See also...
Modeling your ancestry has never been easier
Getting the most out of the Global25
Modeling genetic ancestry with Davidski: step by step


Subscribe to:
Posts (Atom)