search this blog

Showing posts with label Nordic. Show all posts

Sunday, January 17, 2021

That old chestnut: Northeast vs Northwest Euros


In the last comment thread reader Greg put forth this question:

David, when are you going to explain the genetic discrepancy between Northeastern and Northwestern Europeans? You know, the one that people believe is due to Baltic Hunter-Gatherer admixture, whereas you believe it is due to genetic drift? You ought to make a post about this issue at some point, because a lot of people are wondering what's causing the differences.

Well, Greg, this issue has been discussed to the proverbial death here and elsewhere. In fact, there were two posts and rather lengthy comment threads on the same topic at this blog just a few months ago. See here and here.

Nevertheless, it seems that a fair number of people are still befuddled, so I'm going to try to explain this one last time, as briefly as a I can using just a handful of f4-stats.

Admittedly, Northeast Europeans generally do pack higher levels of indigenous European hunter-gatherer ancestry than Northwest Europeans. This is especially true of Balts, who show more of this type of ancestry than even Scandinavians in practically every type of analysis.

The f4-stats below back this up unambiguously. Note the significantly positive (>3) Z scores, which suggest that Latvians and Lithuanians harbor more Baltic hunter-gatherer-related ancestry than Norwegians and Swedes.

Chimp Baltic_HG Norwegian Latvian 0.001301 7.114
Chimp Baltic_HG Swedish Latvian 0.001017 4.205
Chimp Baltic_HG Norwegian Lithuanian 0.001023 7.341
Chimp Baltic_HG Swedish Lithuanian 0.000763 3.408

Greg, I know what you're thinking: the naysayers are right! But wait, because there's a twist to this tale. Check out these f4-stats:

Chimp Baltic_HG Norwegian Belarusian 0.000265 1.934
Chimp Baltic_HG Swedish Belarusian 0.000152 0.7
Chimp Baltic_HG Norwegian Polish 6.4E-05 0.519
Chimp Baltic_HG Swedish Polish -0.000235 -1.074

Please note, Greg, that none of the Z scores reach significance, which means that these Northwest Europeans and Slavs are symmetrically related to Baltic_HG. They're also symmetrically related to other relevant ancient groups such as the Yamnaya steppe herders. This, of course, suggests that they harbor very similar levels of basically the same ancient genetic components.

Chimp Karelia_HG Norwegian Belarusian 0.000136 0.844
Chimp Karelia_HG Swedish Belarusian 7.9E-05 0.32
Chimp Karelia_HG Norwegian Polish -4.7E-05 -0.304
Chimp Karelia_HG Swedish Polish -0.000134 -0.54

Chimp Yamnaya_Samara Norwegian Belarusian -0.000134 -1.085
Chimp Yamnaya_Samara Swedish Belarusian -6.6E-05 -0.34
Chimp Yamnaya_Samara Norwegian Polish -0.000225 -1.995
Chimp Yamnaya_Samara Swedish Polish -0.000311 -1.574

Chimp Barcin_N Norwegian Belarusian -0.000335 -2.809
Chimp Barcin_N Swedish Belarusian -0.000284 -1.491
Chimp Barcin_N Norwegian Polish -0.000222 -2.057
Chimp Barcin_N Swedish Polish -0.000318 -1.662

Chimp Baikal_N Norwegian Belarusian 0.000186 1.3
Chimp Baikal_N Swedish Belarusian -7E-05 -0.33
Chimp Baikal_N Norwegian Polish -4.6E-05 -0.351
Chimp Baikal_N Swedish Polish -0.000477 -2.277

Interestingly, pairing up Ukrainians with English samples from Cornwall and Kent produces similar outcomes. But that's because most ancient ancestry proportions in Europe show a closer correlation with latitude than longitude.

Chimp Baltic_HG English_Cornwall Ukrainian 0.000282 2.242
Chimp Baltic_HG English_Kent Ukrainian 0.000225 1.748

Chimp Karelia_HG English_Cornwall Ukrainian 0.000323 2.175
Chimp Karelia_HG English_Kent Ukrainian 0.000239 1.634

Chimp Yamnaya_Samara English_Cornwall Ukrainian -6.6E-05 -0.569
Chimp Yamnaya_Samara English_Kent Ukrainian -0.000112 -0.977

Chimp Barcin_N English_Cornwall Ukrainian -0.000519 -4.641
Chimp Barcin_N English_Kent Ukrainian -0.000598 -5.232

Chimp Baikal_N English_Cornwall Ukrainian 0.000385 2.874
Chimp Baikal_N English_Kent Ukrainian 0.00036 2.836

Now, Greg, if at least in terms of genetic ancestry, Latvians, Lithuanians, Belarusians, Poles and Ukrainians all qualify as Northeast Europeans, then what makes them different, as a group, from Northwest Europeans? Do you believe that the key factor is admixture from Baltic hunter-gatherers? Or is it genetic drift?

Of course, considering all of the f4-stats above, logic dictates that it must be relatively recent genetic drift.

Keep in mind, however, that this only applies to Balto-Slavic speaking Northeast Europeans without significant Uralian ancestry. Overall, Uralic speakers have a more complex population history, and indeed genetic differences between them and Northwest Europeans are in large part due to somewhat different ancestry proportions and also Siberian admixture.

See also...

So who's the most (indigenous) European of us all?

Tuesday, September 29, 2020

Viking world open analysis and discussion thread


Global25 and Celtic vs Germanic coordinates for most of the samples from the recent Margaryan et al. Viking paper are now available HERE and HERE, respectively. Look for the VK2020 prefix.

Feel free to put them through their paces and let me know what you find. Below are a couple of examples of what can be done with these coordinates using Vahaduo Global25 Views.

See also...

Viking invasion at bioRxiv

Commoner or elite?

Who were the people of the Nordic Bronze Age?

Saturday, December 14, 2019

Avalon vs Valhalla revisited


Pictured below is a new version of my Celtic vs Germanic genetic map. It's based on the same Principal Component Analysis (PCA) as the original (which can be seen here), but more focused on Northwestern Europe and produced with a different program.


To see the interactive online version, navigate to Vahaduo Custom PCA and copy paste the text from here into the empty space under the PCA DATA tab. Then press the PLOT PCA button under the PCA PLOT tab. For more guidance, refer to the screen caps here and here.

To include a wider range of populations in the key, just edit the data accordingly. For instance, to break up the ancient grouping into more specific populations, delete the Ancient: prefix in all of the relevant rows. This is what you should see:


Conversely, you can leave the ancient sample set intact and instead reorder the present-day linguistic groupings into, say, geographic groupings. To achieve this just delete all of the linguistic prefixes, such as Celtic:, Germanic:, and so on. You should end up with a datasheet like this and plot like this.

Of course, you can design your own plot by using any combination of the ancient and present-day individuals and populations that I've already run in this PCA. Their coordinates are listed here. Indeed, if you're in the possession of your own Celtic vs Germanic PCA coordinates, you can add yourself to the plot. And if you're not, see here.

It's also possible to re-process PCA data via the SOURCE tab. But I don't recommend doing this with the Celtic vs Germanic data, which are derived from a fine scale analysis and don't pack much variation. On the other hand, Global25 data are ideal for such re-processing. I made the plots below from subsets of Global25 coordinates available in a zip file here. To see how, refer to the screen caps here and here.


See also...

Modeling your ancestry has never been easier

Getting the most out of the Global25

Modeling genetic ancestry with Davidski: step by step

Wednesday, July 17, 2019

Viking invasion at bioRxiv


A new preprint featuring hundreds of Viking Age genomes has appeared at bioRxiv [LINK]. Titled Population genomics of the Viking world, it looks like a solid effort overall, although I'm skeptical about its conclusions. I might elaborate on that in the comments below, but I'll have a lot more to say on the topic if and when I get to check out the ancient genomes with my own tools. Details about the new samples, including their Y-chromosome haplogroup assignments, are available here. Below is the abstract, emphasis is mine:

The Viking maritime expansion from Scandinavia (Denmark, Norway, and Sweden) marks one of the swiftest and most far-flung cultural transformations in global history. During this time (c. 750 to 1050 CE), the Vikings reached most of western Eurasia, Greenland, and North America, and left a cultural legacy that persists till today. To understand the genetic structure and influence of the Viking expansion, we sequenced the genomes of 442 ancient humans from across Europe and Greenland ranging from the Bronze Age (c. 2400 BC) to the early Modern period (c. 1600 CE), with particular emphasis on the Viking Age. We find that the period preceding the Viking Age was accompanied by foreign gene flow into Scandinavia from the south and east: spreading from Denmark and eastern Sweden to the rest of Scandinavia. Despite the close linguistic similarities of modern Scandinavian languages, we observe genetic structure within Scandinavia, suggesting that regional population differences were already present 1,000 years ago. We find evidence for a majority of Danish Viking presence in England, Swedish Viking presence in the Baltic, and Norwegian Viking presence in Ireland, Iceland, and Greenland. Additionally, we see substantial foreign European ancestry entering Scandinavia during the Viking Age. We also find that several of the members of the only archaeologically well-attested Viking expedition were close family members. By comparing Viking Scandinavian genomes with present-day Scandinavian genomes, we find that pigmentation-associated loci have undergone strong population differentiation during the last millennia. Finally, we are able to trace the allele frequency dynamics of positively selected loci with unprecedented detail, including the lactase persistence allele and various alleles associated with the immune response. We conclude that the Viking diaspora was characterized by substantial foreign engagement: distinct Viking populations influenced the genomic makeup of different regions of Europe, while Scandinavia also experienced increased contact with the rest of the continent.

Margaryan et al., Population genomics of the Viking world, bioRxiv, posted July 17, 2019, doi: https://doi.org/10.1101/703405

See also...

They came, they saw, and they mixed

Who were the people of the Nordic Bronze Age?

Asiatic East Germanics

Saturday, June 1, 2019

They came, they saw, and they mixed


Y-chromosome haplogroup N is strongly associated with Uralic-speaking populations. That's probably because it was a salient feature of the gene pool of the earliest Uralic speakers, and it went with them as they migrated across northern Eurasia. However, some of its younger subclades appear to have spread with the speakers of Indo-European and Turkic languages.

For instance, N-Y10931 seems to be a marker of the Rurikids, a Varangian dynasty that, according to most sources, ruled the Kievan Rus in what are now Russia and Ukraine. And the Kievan Rus was a lose medieval political federation in which Slavic, Finnic (west Uralic) and Germanic languages were probably spoken. The latest on the genetic genealogy of the Rurikids was presented a couple of days ago at the Centenary of Human Population Genetics conference in Moscow, and there's an abstract of the talk available here (download the PDF and scroll down to page 84).

I'm not aware of any Rurikids among the thousands of ancients in my dataset, or even of any samples belonging to N-Y10931. But I do have the genome of someone who belongs to N-Y4339, which, as per the abstract linked to above, is proximally ancestral to N-Y10931. Not only does this person come from Viking Age Scandinavia, but he was buried in a crouched position typical of Slavic funerary customs of the time.

The individual in question is vik_84001. His genome was published recently along with a paper on the population structure of the Swedish town of Sigtuna way back when it was a Viking stronghold (see here). This is where his Y-chromosome sequence, labeled ERS2540883, is positioned on the YFull Y-chromosome phylogenetic tree. Click on the image to go to YFull.


However, the result is likely to be compromised to some extent by missing data. If so, it's possible that vik_84001 does indeed belong to N-Y10931 and ought to be sitting near or even among that cluster of Russian samples (Rurik descendants?) at the bottom of the page.

In any case, vik_84001 seems to be the closest individual in the ancient DNA record to a Rurikid. The Principal Component Analysis (PCA) below is based on my Global25 data. It features 18 other Viking Age individuals from Sigtuna alongside vik_84001 (look for the black dots). The relevant datasheet is available here. Interestingly, despite his eastern Y-haplogroup, vik_84001 is one of the few Sigtuna ancients who clusters strongly with present-day Swedes.
But here's what happens when I model his ancestry proportions with the Global25/nMonte method using a wide range of reference populations from Northern and Eastern Europe. The Swedes in this model are the same as those in the PCA.

vik_84001
Swedish,84.6
Ingrian,9.2
Russian_Tver,6.2

Belarusian,0
Estonian,0
Finnish,0
Finnish_East,0
Karelian,0
Latvian,0
Mordovian,0
Russian_Kostroma,0
Russian_Kursk,0
Russian_Orel,0
Russian_Pinega,0
Russian_Smolensk,0
Russian_Voronez,0
Ukrainian,0
Vepsian,0

[1] "distance%=2.3778"

Yep, despite his position in the PCA, vik_84001 shows a strong signal of ancestry related to the present-day populations of northwestern Russia. I'm not sure what this means exactly, but it's certainly fascinating stuff. And, by the way, I usually wouldn't use so many similar reference populations in a single Global25/nMonte model because of the problem of "overfitting", but in some cases it's OK to do so if the nMonte algorithm has enough recent genetic drift to latch onto.

See also...

More on the association between Uralic expansions and Y-haplogroup N

Fresh off the sledge

Uralic-specific genome-wide ancestry did make a signifcant impact in the East Baltic

It was always going to be this way

Conan the Barbarian probably belonged to Y-haplogroup R1a

Sunday, May 19, 2019

Who were the people of the Nordic Bronze Age?


Ancient DNA has revealed that large scale migrations and population replacements have often accompanied major cultural changes in prehistoric Europe. But, for now, my opinion is that the formation of the archeologically ostentatious Nordic Bronze Age wasn't associated with any significant foreign gene flow into Scandinavia. I've tested this as best as I could with the few relevant ancient samples that are currently available.


For instance, below are among the most successful qpAdm mixture models that I was able find for various ancient Scandinavian groups dating back to the local Middle Neolithic (MN) period. The Nordic Bronze Age population is represented by three individuals labeled Nordic_BA. Unfortunately, the guy pictured above, from the famous Borum Eshøj barrow burial in what is now Denmark, didn't make the cut. For more details about my sampling and labeling strategies refer to the text file here.

Nordic_MN_B
CWC_CZE 0.822±0.059
POL_Globular_Amphora 0.178±0.059
chisq 14.478
tail prob 0.341086
Full output

SWE_Battle_Axe
CWC_Baltic_early 0.662±0.028
POL_Globular_Amphora 0.338±0.028
chisq 11.234
tail prob 0.591189
Full output

Nordic_LN
Nordic_MN_B 0.928±0.069
SWE_TRB 0.072±0.069
chisq 12.139
tail prob 0.516307
Full output

Nordic_BA
Nordic_LN 0.851±0.061
SWE_TRB 0.149±0.061
chisq 10.897
tail prob 0.619475
Full output

It's impossible to successfully model the ancestries of Nordic_MN_B and SWE_Battle_Axe simply with the populations that were living in Scandinavia before them. Therefore, it's likely that they were migrants or the recent descendants of migrants to Scandinavia. But there's nothing surprising about that, because they're archeologically associated with the Corded Ware culture (CWC), which has always been seen as intrusive to Scandinavia from the south and east.

Conversely, it's easy to produce statistically sound mixture models for both Nordic_LN and Nordic_BA exclusively with earlier Scandinavian populations. Indeed, based on the outgroups or right pops that I'm using, Nordic_LN is almost indistinguishable from Nordic_MN_B, and the same can be said of Nordic_BA in regards to Nordic_LN.

Of course, if I mixed and matched reference populations from across prehistoric Europe, I could probably come up with some spectacular statistical fits even without the need for any Scandinavians. Essentially that's because Nordic_LN and Nordic_BA are closely related to many earlier and contemporaneous peoples living all the way from the Atlantic facade to the Ural Mountains. My point, however, is that this isn't crucial, despite the dearth of ancient samples from Scandinavia.

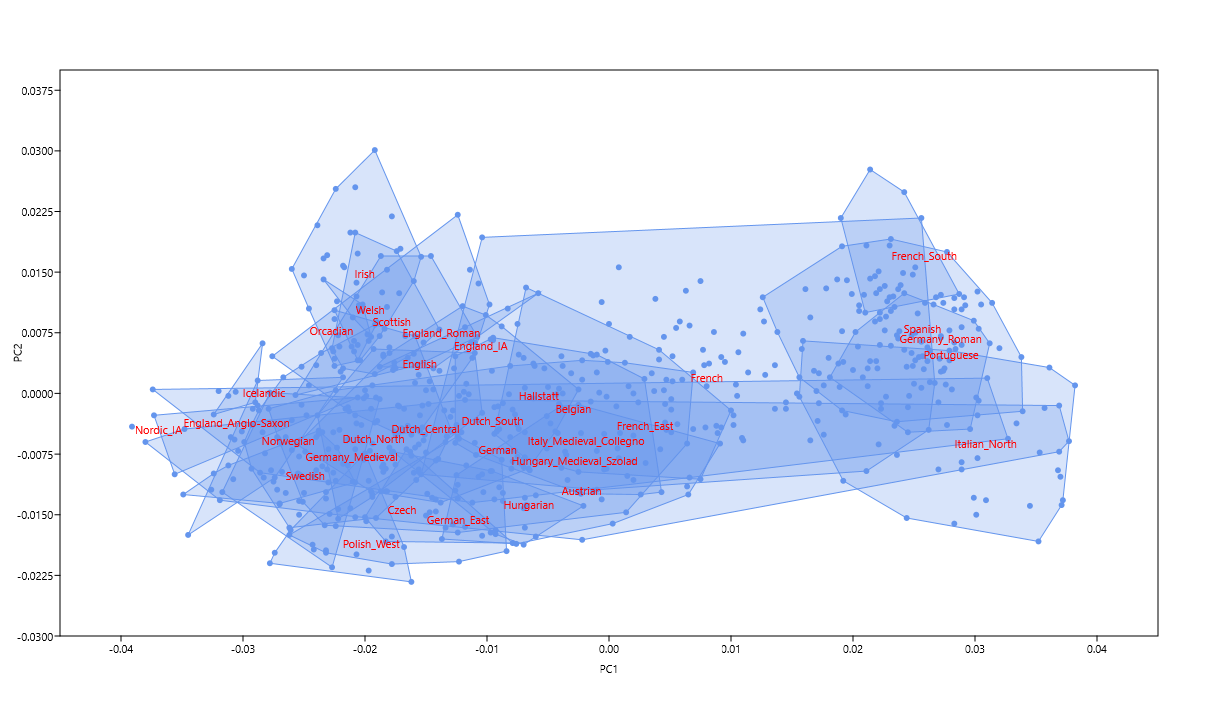
This is how things look in a Principal Component Analysis (PCA) of Northern European genetic variation based on my Global25 data. Strikingly, Nordic_MN_B, SWE_Battle_Axe, Nordic_LN and Nordic_BA more or less recapitulate the cluster made up of present-day Swedish samples. The relevant datasheet is available here.
Granted, two of the Nordic_BA samples sit just south of the Swedes, no doubt due to their slightly higher ratios of Neolithic farmer (SWE_TRB-related) ancestry, but this is also an area of the plot that many present-day Danes call home (not shown, because I don't have any suitable academic Danish samples to run).

I'll eat my hat if it turns out that Scandinavia experienced a major population shift (say, more than a collateral ~10%) during the LN and/or BA periods. And I'll post a clip of it online too.

Update 27/08/2019: Four of the samples from the recent Frei et al. paper on human mobility in prehistoric southern Scandinavia are in my Global25 datasheets. So I thought it might be interesting to check whether their strontium isotope ratios correlated with their genomic profiles.

In the Principal Component Analysis (PCA) below, RISE61 is a subtle outlier along the horizontal axis compared to the other three Nordic ancients, as well as a Danish individual representative of the present-day Danish gene pool. Also note that RISE61 shows the most unusual strontium isotope ratio (0.712588). The PCA was run with an online tool freely available here.


To help drive the point home, here's a figure from Frei et al., edited by me to show the positions of RISE47, RISE61 and RISE71. If RISE276 was also in this graph, he'd be sitting well under the "local" baseline, in roughly the same spot along the vertical axis as RISE47.


Interestingly, RISE61 belongs to Y-chromosome haplogroup R1a-M417, while RISE47 and RISE276, who appear to have been locals, both belong to R1b-M269. My guess is that RISE61 was a recent migrant from a more northerly part of Scandinavia dominated by the Battle-Axe culture (BAC). The BAC population was probably rich in R1a-M417 because it moved into Scandinavia from the Pontic-Caspian steppe via the East Baltic. This is what Frei et al. say about RISE61 and his burial site:

The double passage grave of Kyndeløse (Fig 1, S1 File) located on the island of Zealand yielded 70 individuals as well as a large number of grave goods, including flint artefacts, ceramics, and tooth and amber beads. We conducted strontium isotope analyses of seven individuals from Kyndeløse encompassing a period of c. 1000 years, indicating the prolonged use of this passage grave. The oldest of the seven individuals is a female (RISE 65) from whom we measured a “local” strontium isotope signature ( 87 Sr/ 86 Sr = 0.7099). Similar values were measured in five other individuals, including adult males and females. Only a single individual from Kyndeløse, an adult male (RISE 61) yielded a somewhat different strontium isotope signature of 87 Sr/ 86 Sr = 0.7126 which seems to indicate a non-local provenance. The skull of this male individual revealed healed porosities in the eye orbits, cribra orbitalia, a condition which is possibly linked to a vitamin deficiency during childhood, such as iron deficiency.

By the way, RISE47 was buried in a flat grave, which suggests that he was a commoner. RISE276 was found in a peat bog in Trundholm, where the famous Trundholm sun chariot was discovered (see here). He may have been a human sacrifice.

Citation...

Frei KM, Bergerbrant S, Sjögren K-G, Jørkov ML, Lynnerup N, Harvig L, et al. (2019) Mapping human mobility during the third and second millennia BC in present-day Denmark. PLoS ONE 14(8): e0219850. https://doi.org/10.1371/journal.pone.0219850

See also...

They came, they saw, and they mixed

Children of the Divine Twins

The mystery of the Sintashta people

Sunday, September 16, 2018

Celtic vs Germanic Europe


I have a feeling that ancient DNA from post-Bronze Age Northwestern Europe will be coming thick and fast from now on. To get the most out of such data I've designed a new Principal Component Analysis (PCA) that does a better job of separating the Celtic- and Germanic-speaking populations of Europe than my previous efforts of this sort (see here and here). Below are two different versions of the same PCA. The relevant datasheet is available here.

And here's a Discrimination Analysis (LDA) plot based on the 25 principal components. It further differentiates many of the populations along the east > west cline of genetic diversity.


The difference between the Germanic Anglo-Saxons and the Celtic and Roman Britons of what is now eastern England is obvious. The Anglo-Saxons could pass for Scandinavians, while the Celts and Romans both cluster between the Irish and French. This makes good sense, and is exactly what I was looking for. It's also interesting to see the presumably Celtic-speaking Hallstatt samples from Bylany, Czechia, clustering with the Belgians.

Update 14/12/2019: Pictured below is a new version of my Celtic vs Germanic genetic map. It's based on the same Principal Component Analysis (PCA) as the original, but more focused on Northwestern Europe and produced with a different program.


To see the interactive online version, navigate to Vahaduo Custom PCA and copy paste the text from here into the empty space under the PCA DATA tab. Then press the PLOT PCA button under the PCA PLOT tab. For more guidance, refer to the screen caps here and here.

To include a wider range of populations in the key, just edit the data accordingly. For instance, to break up the ancient grouping into more specific populations, delete the Ancient: prefix in all of the relevant rows. This is what you should see:


Conversely, you can leave the ancient sample set intact and instead reorder the present-day linguistic groupings into, say, geographic groupings. To achieve this just delete all of the linguistic prefixes, such as Celtic:, Germanic:, and so on. You should end up with a datasheet like this and plot like this.

Of course, you can design your own plot by using any combination of the ancient and present-day individuals and populations that I've already run in this PCA. Their coordinates are listed here. Indeed, if you're in the possession of your own Celtic vs Germanic PCA coordinates, you can add yourself to the plot. And if you're not, see here.

It's also possible to re-process PCA data via the SOURCE tab. But I don't recommend doing this with the Celtic vs Germanic data, which are derived from a fine scale analysis and don't pack much variation. On the other hand, Global25 data are ideal for such re-processing. I made the plots below from subsets of Global25 coordinates available in a zip file here. To see how, refer to the screen caps here and here.


See also...

Modeling your ancestry has never been easier

Getting the most out of the Global25

Modeling genetic ancestry with Davidski: step by step