search this blog

Showing posts with label Northern Europe. Show all posts

Friday, November 10, 2023

Wielbark Goths were overwhelmingly of Scandinavian origin


When used properly, Principal Component Analysis (PCA) is an extraordinarily powerful tool and one of the best ways to study fine-scale genetic substructures within Europe.

The PCA plot below is based on Global25 data and focuses on the genetic relationship between Wielbark Goths and Medieval Poles, including from the Viking Age, in the context of present-day European genetic variation.


I'd say that it's a wonderfully self-explanatory plot, but here are some key observations:

- the Wielbark Goths (Poland_Wielbark_IA) and Medieval Poles (Poland_Middle_Ages) are two distinct populations

- moreover, the Wielbark Goths form a relatively compact Scandinavian-related cluster and must surely represent a homogenous population overwhelmingly of Scandinavian origin

- on the other hand, the Medieval Poles form a more extensive and heterogeneous cluster that overlaps with present-day groups all the way from Central Europe to the East Baltic, and that's because they are likely to be in large part of mixed origin

- I know for a fact that at least some of these early Poles harbor recent admixture, because their burials are similar to those of Vikings and their haplotypes have been shown to be partly of Scandinavian origin (see here)

- one of the Wielbark females is an obvious genetic outlier (Poland_Wielbark_IA_outlier), and basically looks like a first generation mixture between a Goth and a Balt.

Please note that the PCA is only based on relatively high quality genomes, so as not to confuse the picture with spurious results and noise. Also, all outliers with potentially significant ancestry from outside of Central, Eastern and Northern Europe were removed from the analysis. The relevant datasheet is available here.

However, sanity checks are always important when studying complex topics like fine-scale genetic ancestry. To that end I've prepared a graph based on f3-statistics of the form f3(X,Cameroon_SMA,Estonia_BA)/(X,Cameroon_SMA,Ireland_Megalithic), that reproduces the key features of my PCA. The relevant datasheet is available here.

Polish groups from the Middle Ages are marked with the MA suffix, while the Iron Age Wielbark Goths are marked with the IA suffix.

If you're wondering why I plotted the f3-statistics that I did, take a look at this (all groups largely of Scandinavian origin are emboldened):

f3(X,Estonia_BA,Cameroon_SMA)
Poland_Legowo_MA 0.226406
Poland_Ostrow_Lednicki_MA 0.225996
Poland_Plonsk_MA 0.225017
Poland_Trzciniec_Culture 0.224215
Poland_Lad_MA 0.224142
Poland_Viking 0.223838
Poland_Niemcza_MA 0.223659
Poland_Weklice_IA 0.223549
Poland_Kowalewko_IA 0.222584
Poland_Pruszcz_Gdanski_IA 0.222324
Sweden_Viking 0.222091
Russia_Viking 0.222042
Poland_Maslomecz_IA 0.221914
Norway_Viking 0.221825
Denmark_EarlyViking 0.221257
Denmark_Viking 0.221174
England_Viking 0.220979

f3(X,Ireland_Megalithic,Cameroon_SMA)
Poland_Maslomecz_IA 0.219816
Poland_Weklice_IA 0.219501
Denmark_Viking 0.2192
Poland_Kowalewko_IA 0.219176
Poland_Ostrow_Lednicki_MA 0.218916
Norway_Viking 0.218854
Poland_Pruszcz_Gdanski_IA 0.218684
Sweden_Viking 0.218626
Denmark_EarlyViking 0.218529
England_Viking 0.218308
Russia_Viking 0.217999
Poland_Viking 0.217914
Poland_Plonsk_MA 0.217756
Poland_Lad_MA 0.217719
Poland_Legowo_MA 0.21765
Poland_Niemcza_MA 0.217001
Poland_Trzciniec_Culture 0.216551

Interestingly, the Middle Bronze Age samples associated with the Trzciniec Culture (Poland_Trzciniec_Culture) show a closer genetic relationship to Medieval Poles than to Wielbark Goths or Northwestern Europeans. This is indeed the case both in terms of genome-wide and uniparental markers, including some very specific lineages under Y-chromosome haplogroup R1a.

But that's a much more complex issue that I'll leave for another time. So please stay tuned.

See also...

Slavs have little, if any, Scytho-Sarmatian ancestry

Monday, February 21, 2022

The Pict


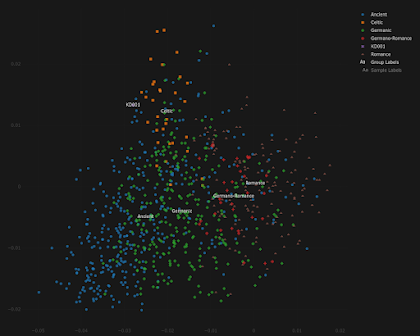
KD001 is the first undeniable Pictish sample in my dataset, courtesy of Dulias et al. 2022. Thanks to Altvred for processing the files.

This is how KD001 behaves in my Celtic vs Germanic Principal Component Analysis (PCA). Looks kind of Irish, doesn't he?


To see an interactive version of the plot, paste the coordinates from here into the relevant field here.

See also...

Celtic vs Germanic Europe

Avalon vs Valhalla revisited

When did Celtic languages arrive in Britain?

Friday, August 27, 2021

R1a vs R1b in third millennium BCE Central Europe (Papac et al. 2021)


R1a-M417 and R1b-L51 are by far the most important Y-chromosome haplogroups in Europe today. More precisely, R1a-M417 dominates in Eastern Europe, while R1b-L51 in Western Europe.

It's been obvious for a while now, at least to me, that both of these Y-haplogroups are closely associated with the men of the Late Neolithic Corded Ware culture (CWC). Indeed, in my mind they're the main genetic signals of its massive expansion, probably from a homeland somewhere north of the Black Sea in what is now Ukraine.

I'm still not exactly sure how the east/west dichotomy between R1a and R1b emerged in Europe, but, thanks to a new paper by Papac et al. at Science Advances, at least now I have a working hypothesis about that. Below is a quote from the said paper, emphasis is mine:

In addition to autosomal genetic changes through time, we observe a sharp reduction in Y-chromosomal diversity going from five different lineages in early CW to a dominant (single) lineage in late CW (Fig. 4A). We used forward simulations to explore the demographic scenarios that could account for the observed reduction in Y-chromosomal diversity. Performing 1 million simulations of a population with a starting frequency of R1a-M417(xZ645) centered around the observed starting frequency in Bohemia_CW_Early (3 of 11, 0.27), we assessed the plausibility of this lineage reaching the observed frequency in Bohemia_CW_Late (10 of 11, 0.91) in the time frame of 500 years under a model of a closed population and random mating (Materials and Methods). We reject the “neutral” hypothesis, i.e., that this change in frequency occurred by chance, given a wide range of plausible population sizes. Instead, our results suggest that R1a-M417(xZ645) was subject to a nonrandom increase in frequency, resulting in these males having 15.79% (4.12 to 44.42%) more surviving offspring per generation relative to males of other Y-haplogroups. We also find that this change in Y chromosome frequency is extreme compared to the changes in allele frequencies at fully covered autosomal 1240k sites within the same males, suggesting a process that disproportionately affected Y-chromosomal compared to autosomal genetic diversity, ruling out a population bottleneck as the likely cause. Our results suggest that the Y-lineage diversity in early CW males was supplanted by a nonrandom process [selection, social structure, or influx of nonlocal R1a-M417(xZ645) lineages] that drove the collapse in Y-chromosomal diversity. A simultaneous decline of Y-chromosomal diversity dating to the Neolithic has been observed across most extant Y-haplogroups (64), possibly due to increased conflict between male-mediated patrilines (65). We view that changes in social structure (e.g., an isolated mating network with strictly exclusive social norms) could be an alternative cause but would be difficult to distinguish in the underlying model parameters.

Right, so even though the CWC was clearly a community of closely related groups, there must have been some competition between its different clans. And since these clans were highly patriarchal and patrilineal, this competition probably led to different paternal lineages dominating different parts of the CWC horizon, with M417 becoming especially common in the east and L51 in the west.

Of course, the expansions of post-Corded Ware groups, such as the M417-rich Slavs in Eastern Europe and L51-rich Celts in Western Europe, were also instrumental in creating Europe's R1a/R1b dichotomy, but obviously these groups were in large part the heirs of the CWC.

By the way, most of the samples from Papac et al. are already in the Global25 datasheets linked here. Look for the labels listed here. Below is a plot made from the Global25 data courtesy of regular commentator Matt.
Citation: L. Papac, M. Ernée, M. Dobeš, M. Langová, A. B. Rohrlach, F. Aron, G. U. Neumann, M. A. Spyrou, N. Rohland, P. Velemínský, M. Kuna, H. Brzobohatá, B. Culleton, D. Daněček, A. Danielisová, M. Dobisíková, J. Hložek, D. J. Kennett, J. Klementová, M. Kostka, P. Krištuf, M. Kuchařík, J. K. Hlavová, P. Limburský, D. Malyková, L. Mattiello, M. Pecinovská, K. Petriščáková, E. Průchová, P. Stránská, L. Smejtek, J. Špaček, R. Šumberová, O. Švejcar, M. Trefný, M. Vávra, J. Kolář, V. Heyd, J. Krause, R. Pinhasi, D. Reich, S. Schiffels, W. Haak, Dynamic changes in genomic and social structures in third millennium BCE central Europe. Sci. Adv. 7, eabi6941 (2021).

See also...

On the origin of the Corded Ware people

Understanding the Eneolithic steppe

Conan the Barbarian probably belonged to Y-haplogroup R1a

Sunday, January 17, 2021

A tantalizing link


A new paper at PLoS ONE reports on the first human genomes reliably associated with the Single Grave culture (SGC). They were sequenced from remains in a burial at Gjerrild, Denmark, roughly dating to 2,500 BCE.

Surprisingly, one of the male genomes belongs to Y-haplogroup R1b-V1636, which is an exceedingly rare marker both in ancient and present-day populations.

However, the results do make sense, because the earliest instances of R1b-V1636 are in three Eneolithic males from burial sites on the Pontic-Caspian (PC) steppe in Eastern Europe, which is precisely where one would expect to find the paternal ancestors of the SGC population. The SGC, of course, is the westernmost variant of the Corded Ware culture (CWC), and there's very little doubt nowadays that the CWC had its roots on the PC steppe.

A Copper Age individual from Arslantepe in central Anatolia also belongs to R1b-V1636, which suggests that Northern Europe shared a very specific link with Anatolia via Eastern Europe during a period generally regarded to have been the time of early Indo-European dispersals.

Numerous SGC barrows or kurgans dot the landscape in what are now the Netherlands, northwestern Germany and Denmark. Unfortunately, most SGC human remains have been eaten up by the acidic soils that exist in this area.

Citation: Egfjord AF-H, Margaryan A, Fischer A, Sjögren K-G, Price TD, Johannsen NN, et al. (2021) Genomic Steppe ancestry in skeletons from the Neolithic Single Grave Culture in Denmark. PLoS ONE 16(1): e0244872. https://doi.org/10.1371/journal.pone.0244872

See also...

Maykop ancestry in Copper Age Arslantepe

Saturday, November 7, 2020

Slavic-like Medieval Germans


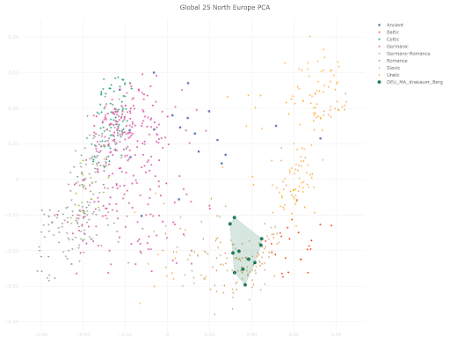
The samples labeled DEU_MA_Krakauer_Berg in the Principal Component Analysis (PCA) plot below are from a recent paper by Parker et al. at Scientific Reports. Their remains were excavated from a Medieval cemetery in the now abandoned village of Krakauer Berg in eastern Germany.

Krakauer sounds sort of like Kraków, doesn't it? That's probably not a coincidence, especially considering how these people behave in my analysis. To see an interactive version of the plot, paste the coordinates from the text file here into the relevant field here.

See also...

Yamnaya-related ancestry proportions in present-day Poles

Warriors from at least two different populations fought in the Tollense Valley battle

Viking world open analysis and discussion thread

Tuesday, September 8, 2020

Warriors from at least two different populations fought in the Tollense Valley battle


I can't get the genotype data from the Burger et al. paper. The lead authors, Joachim Burger and Daniel Wegmann, aren't replying to my emails.

But they were gracious enough to release the BAM files for each of their samples, and these files can be converted to genotype data. So I've included ten of the Tollense Valley warriors (DEU_Tollense_BA) in the Global25 datasheets (see here).

The claim in the paper that these warriors "represent an unstructured population" is absolutely false and extremely naive.

Below are a couple of Principal Component Analysis (PCA) plots produced with Vahaduo Global25 views. The samples are labeled according to their Y-chromosome haplogroups. To see interactive versions of the same plots, paste the Global25 coordinates from the text file here into the relevant fields here.


These warriors are not a single unstructured population, because they cover too much ground in the above plots for that to be possible. It's clear to me that they represent at least two different groups from Central Europe and surrounds.

Of course, this would be a lot easier to work out if Burger et al. cared to supply more information about each of the warriors, such as their attire, weapons, circumstances of death, and so on. It's a complete mystery to me why this wasn't included in the paper, and the authors are refusing to talk to me, so it's unlikely that I'll ever be able to get it from them.

In the absence of such crucial archeological and anthropological data, I don't want to speculate too much, and get overly creative, but here are a couple of possible scenarios to explain the ancient DNA results:
- this may have been a battle between two Central European armies, one rich in Y-haplogroup R1b and the other rich in Y-haplogroup I2a, as well as their allies or hired help, including warriors from Eastern Europe belonging to Y-haplogroup R1a

- or perhaps it was an invasion from the east by warriors rich in Y-haplogroup R1a, and it was a success, with the local armies, rich in Y-haplogroups R1b and I2a, losing the battle and suffering most of the casualties.

I'm sure that one day someone will attempt to undertake a decent multidisciplinary study of this epic battle, and we'll at least have a rough idea about what happened. Or not.

Citation...

Burger et al., Low Prevalence of Lactase Persistence in Bronze Age Europe Indicates Ongoing Strong Selection over the Last 3,000 Years, Current Biology, Available online 3 September 2020, https://doi.org/10.1016/j.cub.2020.08.033

See also...

Genetic and linguistic structure across space and time in Northern Europe

Sunday, September 6, 2020

Low prevalence of lactase persistence in Bronze Age Europe (Burger et al. 2020)


Over at Current Biology at this LINK. Unfortunately, this is the long-awaited Tollense Valley battle paper. Despite the obvious presence of some very interesting genetic substructures among the Tollense Valley warriors (see here), the authors have the audacity to claim that these individuals represent a "single unstructured Central/Northern European population".

One of the warriors, labeled WEZ56, belongs to Y-haplogroup R1a and shows an exceedingly Balto-Slavic-like genome-wide genetic structure. But none of this is even mentioned in passing in the paper. Indeed, according to Burger at al., WEZ56 is best classified as belonging to R1, even though the R1a classification is quite secure based on the raw data that the authors posted online.

Be extremely wary of what you read in this paper, and anything else that these scientists have published in the past and will publish in the future. Below is the paper summary:

Lactase persistence (LP), the continued expression of lactase into adulthood, is the most strongly selected single gene trait over the last 10,000 years in multiple human populations. It has been posited that the primary allele causing LP among Eurasians, rs4988235-A [1], only rose to appreciable frequencies during the Bronze and Iron Ages [2, 3], long after humans started consuming milk from domesticated animals. This rapid rise has been attributed to an influx of people from the Pontic-Caspian steppe that began around 5,000 years ago [4, 5]. We investigate the spatiotemporal spread of LP through an analysis of 14 warriors from the Tollense Bronze Age battlefield in northern Germany (∼3,200 before present, BP), the oldest large-scale conflict site north of the Alps. Genetic data indicate that these individuals represent a single unstructured Central/Northern European population. We complemented these data with genotypes of 18 individuals from the Bronze Age site Mokrin in Serbia (∼4,100 to ∼3,700 BP) and 37 individuals from Eastern Europe and the Pontic-Caspian Steppe region, predating both Bronze Age sites (∼5,980 to ∼3,980 BP). We infer low LP in all three regions, i.e., in northern Germany and South-eastern and Eastern Europe, suggesting that the surge of rs4988235 in Central and Northern Europe was unlikely caused by Steppe expansions. We estimate a selection coefficient of 0.06 and conclude that the selection was ongoing in various parts of Europe over the last 3,000 years.

Burger et al., Low Prevalence of Lactase Persistence in Bronze Age Europe Indicates Ongoing Strong Selection over the Last 3,000 Years, Current Biology, Available online 3 September 2020, https://doi.org/10.1016/j.cub.2020.08.033

See also...

Warriors from at least two different populations fought in the Tollense Valley battle

Saturday, December 14, 2019

Avalon vs Valhalla revisited


Pictured below is a new version of my Celtic vs Germanic genetic map. It's based on the same Principal Component Analysis (PCA) as the original (which can be seen here), but more focused on Northwestern Europe and produced with a different program.


To see the interactive online version, navigate to Vahaduo Custom PCA and copy paste the text from here into the empty space under the PCA DATA tab. Then press the PLOT PCA button under the PCA PLOT tab. For more guidance, refer to the screen caps here and here.

To include a wider range of populations in the key, just edit the data accordingly. For instance, to break up the ancient grouping into more specific populations, delete the Ancient: prefix in all of the relevant rows. This is what you should see:


Conversely, you can leave the ancient sample set intact and instead reorder the present-day linguistic groupings into, say, geographic groupings. To achieve this just delete all of the linguistic prefixes, such as Celtic:, Germanic:, and so on. You should end up with a datasheet like this and plot like this.

Of course, you can design your own plot by using any combination of the ancient and present-day individuals and populations that I've already run in this PCA. Their coordinates are listed here. Indeed, if you're in the possession of your own Celtic vs Germanic PCA coordinates, you can add yourself to the plot. And if you're not, see here.

It's also possible to re-process PCA data via the SOURCE tab. But I don't recommend doing this with the Celtic vs Germanic data, which are derived from a fine scale analysis and don't pack much variation. On the other hand, Global25 data are ideal for such re-processing. I made the plots below from subsets of Global25 coordinates available in a zip file here. To see how, refer to the screen caps here and here.


See also...

Modeling your ancestry has never been easier

Getting the most out of the Global25

Modeling genetic ancestry with Davidski: step by step

Monday, November 25, 2019

Viking Age Iceland


I finally managed to get some of the Icelandic ancients from Ebenesersdóttir et al. 2018 into the Global25 datasheets (see here). Better late than never. Look for the"ISL_Viking_Age" prefix. Below is a screen cap of a Principal Component Analysis (PCA) with the new samples. It was done with an online Global25 PCA runner freely available here.


The individuals classified as unadmixed Gaels and Norse by Ebenesersdóttir et al. generally also look like it based on their Global25 coordinates.

The mixture models below, using all of the populations from the Global25 "modern pop averages scaled" datasheet, were run with an online tool freely available here. Note that the ADD DIST COL option is set to 1X. This is a useful feature for modeling the fine scale ancestry of samples that are derived from very similar populations.


See also...

They came, they saw, and they mixed

Commoner or elite?

Who were the people of the Nordic Bronze Age?

Tuesday, August 27, 2019

Isotopes vs ancient DNA in prehistoric Scandinavia


Four of the samples from the recent Frei et al. paper on human mobility in prehistoric southern Scandinavia are in my Global25 datasheets. Their genomes were published along with Allentoft et al. back in 2015. So I thought it might be interesting to check whether their strontium isotope ratios correlated with their genomic profiles.

In the Principal Component Analysis (PCA) below, RISE61 is a subtle outlier along the horizontal axis compared to the other three Nordic ancients, as well as a Danish individual representative of the present-day Danish gene pool. Also note that RISE61 shows the most unusual strontium isotope ratio (0.712588). The PCA was run with an online tool freely available here.


To help drive the point home, here's a figure from Frei et al., edited by me to show the positions of RISE47, RISE61 and RISE71. If RISE276 was also in this graph, he'd be sitting well under the "local" baseline, in roughly the same spot along the vertical axis as RISE47.


Interestingly, RISE61 belongs to Y-chromosome haplogroup R1a-M417, while RISE47 and RISE276, who appear to have been locals, both belong to R1b-M269. My guess is that RISE61 was a recent migrant from a more northerly part of Scandinavia dominated by the Battle-Axe culture (BAC). The BAC population was probably rich in R1a-M417 because it moved into Scandinavia from the Pontic-Caspian steppe via the East Baltic. This is what Frei et al. say about RISE61 and his burial site:

The double passage grave of Kyndeløse (Fig 1, S1 File) located on the island of Zealand yielded 70 individuals as well as a large number of grave goods, including flint artefacts, ceramics, and tooth and amber beads. We conducted strontium isotope analyses of seven individuals from Kyndeløse encompassing a period of c. 1000 years, indicating the prolonged use of this passage grave. The oldest of the seven individuals is a female (RISE 65) from whom we measured a “local” strontium isotope signature ( 87 Sr/ 86 Sr = 0.7099). Similar values were measured in five other individuals, including adult males and females. Only a single individual from Kyndeløse, an adult male (RISE 61) yielded a somewhat different strontium isotope signature of 87 Sr/ 86 Sr = 0.7126 which seems to indicate a non-local provenance. The skull of this male individual revealed healed porosities in the eye orbits, cribra orbitalia, a condition which is possibly linked to a vitamin deficiency during childhood, such as iron deficiency.

By the way, RISE47 was buried in a flat grave, which suggests that he was a commoner. RISE276 was found in a peat bog in Trundholm, where the famous Trundholm sun chariot was discovered (see here). He may have been a human sacrifice.

Citation...

Frei KM, Bergerbrant S, Sjögren K-G, Jørkov ML, Lynnerup N, Harvig L, et al. (2019) Mapping human mobility during the third and second millennia BC in present-day Denmark. PLoS ONE 14(8): e0219850. https://doi.org/10.1371/journal.pone.0219850

See also...

Commoner or elite?

Who were the people of the Nordic Bronze Age?

They came, they saw, and they mixed

Wednesday, July 17, 2019

Viking invasion at bioRxiv


A new preprint featuring hundreds of Viking Age genomes has appeared at bioRxiv [LINK]. Titled Population genomics of the Viking world, it looks like a solid effort overall, although I'm skeptical about its conclusions. I might elaborate on that in the comments below, but I'll have a lot more to say on the topic if and when I get to check out the ancient genomes with my own tools. Details about the new samples, including their Y-chromosome haplogroup assignments, are available here. Below is the abstract, emphasis is mine:

The Viking maritime expansion from Scandinavia (Denmark, Norway, and Sweden) marks one of the swiftest and most far-flung cultural transformations in global history. During this time (c. 750 to 1050 CE), the Vikings reached most of western Eurasia, Greenland, and North America, and left a cultural legacy that persists till today. To understand the genetic structure and influence of the Viking expansion, we sequenced the genomes of 442 ancient humans from across Europe and Greenland ranging from the Bronze Age (c. 2400 BC) to the early Modern period (c. 1600 CE), with particular emphasis on the Viking Age. We find that the period preceding the Viking Age was accompanied by foreign gene flow into Scandinavia from the south and east: spreading from Denmark and eastern Sweden to the rest of Scandinavia. Despite the close linguistic similarities of modern Scandinavian languages, we observe genetic structure within Scandinavia, suggesting that regional population differences were already present 1,000 years ago. We find evidence for a majority of Danish Viking presence in England, Swedish Viking presence in the Baltic, and Norwegian Viking presence in Ireland, Iceland, and Greenland. Additionally, we see substantial foreign European ancestry entering Scandinavia during the Viking Age. We also find that several of the members of the only archaeologically well-attested Viking expedition were close family members. By comparing Viking Scandinavian genomes with present-day Scandinavian genomes, we find that pigmentation-associated loci have undergone strong population differentiation during the last millennia. Finally, we are able to trace the allele frequency dynamics of positively selected loci with unprecedented detail, including the lactase persistence allele and various alleles associated with the immune response. We conclude that the Viking diaspora was characterized by substantial foreign engagement: distinct Viking populations influenced the genomic makeup of different regions of Europe, while Scandinavia also experienced increased contact with the rest of the continent.

Margaryan et al., Population genomics of the Viking world, bioRxiv, posted July 17, 2019, doi: https://doi.org/10.1101/703405

See also...

They came, they saw, and they mixed

Who were the people of the Nordic Bronze Age?

Asiatic East Germanics

Monday, July 15, 2019

Asiatic East Germanics


Around a third of the ancient individuals in my dataset associated with East Germanic-speaking cultures show obvious ancestry from Central and/or West Asia.

This shouldn't be too surprising, considering, for instance, the well documented contacts between East Germanic tribes and the Avars, Huns, Sarmatians and other nomadic groups that streamed into Europe from the Asian steppes during the Migration Period. It's a topic that I've raised before at this blog (see here).

But the curious thing is that very little, if any, of this ancestry has percolated down to present-day Europeans.

The easiest way to show this is with a Principal Component Analysis (PCA) based on my Global25 data. The relevant PCA datasheet can be downloaded here. Basic details about the ancient samples in the analysis are available here.

Some of the Northeastern European populations, particularly the Uralic speakers, appear to be attracted to the Hunnic cluster. However, this is mostly an artifact of pre-Migration Period east to west population expansions in the far north of Europe, probably including those of the Proto-Uralians (see here).

So how is it that, despite ruling over vast areas of Europe for hundreds of years, the East Germanics appear not to have contributed significantly to the present-day European gene pool? My theory is that, much like the Avars and Huns, they were militarily and demographically overwhelmed by the ascending groups around them, such as the Slavs, and they simply went extinct.

To wrap things up, here's a basic qpAdm mixture model designed to test for Hunnic-related ancestry in a few Eastern and Northern European populations of interest. Note the significant slice of this type of ancestry in the likely early Goths of the Chernyakhiv culture. Is it real? Feel free to share your thoughts in the comments below.

UKR_Chernyakhiv
DEU_MA 0.863±0.038
Hun_Tian_Shan 0.137±0.038
chisq 12.525
tail prob 0.325466
Full output

Swedish
Baltic_EST_IA 0.126±0.078
DEU_MA 0.849±0.073
Hun_Tian_Shan 0.025±0.020
chisq 8.338
tail prob 0.595877
Full output

Ukrainian
Baltic_EST_IA 0.121±0.064
DEU_MA 0.857±0.060
Hun_Tian_Shan 0.022±0.017
chisq 11.458
tail prob 0.322956
Full output

Estonian
Baltic_EST_IA 0.597±0.069
DEU_MA 0.373±0.064
Hun_Tian_Shan 0.030±0.017
chisq 15.739
tail prob 0.107361
Full output

See also...

Conan the Barbarian probably belonged to Y-haplogroup R1a

More on the association between Uralic expansions and Y-haplogroup N

Uralic-specific genome-wide ancestry did make a signifcant impact in the East Baltic

Saturday, June 15, 2019

Not Bell Beaker, not Corded Ware, but...the SGBR complex


I'd be very grateful if someone could explain to me what this new paper at the Proceedings of the Prehistoric Society journal was actually about.

Citation...

Furholt, Martin, Re-integrating Archaeology: A Contribution to aDNA Studies and the Migration Discourse on the 3rd Millennium BC in Europe, Proceedings of the Prehistoric Society, Published online: 10 June 2019, DOI: https://doi.org/10.1017/ppr.2019.4

See also...


Sunday, May 19, 2019

Who were the people of the Nordic Bronze Age?


Ancient DNA has revealed that large scale migrations and population replacements have often accompanied major cultural changes in prehistoric Europe. But, for now, my opinion is that the formation of the archeologically ostentatious Nordic Bronze Age wasn't associated with any significant foreign gene flow into Scandinavia. I've tested this as best as I could with the few relevant ancient samples that are currently available.


For instance, below are among the most successful qpAdm mixture models that I was able find for various ancient Scandinavian groups dating back to the local Middle Neolithic (MN) period. The Nordic Bronze Age population is represented by three individuals labeled Nordic_BA. Unfortunately, the guy pictured above, from the famous Borum Eshøj barrow burial in what is now Denmark, didn't make the cut. For more details about my sampling and labeling strategies refer to the text file here.

Nordic_MN_B
CWC_CZE 0.822±0.059
POL_Globular_Amphora 0.178±0.059
chisq 14.478
tail prob 0.341086
Full output

SWE_Battle_Axe
CWC_Baltic_early 0.662±0.028
POL_Globular_Amphora 0.338±0.028
chisq 11.234
tail prob 0.591189
Full output

Nordic_LN
Nordic_MN_B 0.928±0.069
SWE_TRB 0.072±0.069
chisq 12.139
tail prob 0.516307
Full output

Nordic_BA
Nordic_LN 0.851±0.061
SWE_TRB 0.149±0.061
chisq 10.897
tail prob 0.619475
Full output

It's impossible to successfully model the ancestries of Nordic_MN_B and SWE_Battle_Axe simply with the populations that were living in Scandinavia before them. Therefore, it's likely that they were migrants or the recent descendants of migrants to Scandinavia. But there's nothing surprising about that, because they're archeologically associated with the Corded Ware culture (CWC), which has always been seen as intrusive to Scandinavia from the south and east.

Conversely, it's easy to produce statistically sound mixture models for both Nordic_LN and Nordic_BA exclusively with earlier Scandinavian populations. Indeed, based on the outgroups or right pops that I'm using, Nordic_LN is almost indistinguishable from Nordic_MN_B, and the same can be said of Nordic_BA in regards to Nordic_LN.

Of course, if I mixed and matched reference populations from across prehistoric Europe, I could probably come up with some spectacular statistical fits even without the need for any Scandinavians. Essentially that's because Nordic_LN and Nordic_BA are closely related to many earlier and contemporaneous peoples living all the way from the Atlantic facade to the Ural Mountains. My point, however, is that this isn't crucial, despite the dearth of ancient samples from Scandinavia.

This is how things look in a Principal Component Analysis (PCA) of Northern European genetic variation based on my Global25 data. Strikingly, Nordic_MN_B, SWE_Battle_Axe, Nordic_LN and Nordic_BA more or less recapitulate the cluster made up of present-day Swedish samples. The relevant datasheet is available here.
Granted, two of the Nordic_BA samples sit just south of the Swedes, no doubt due to their slightly higher ratios of Neolithic farmer (SWE_TRB-related) ancestry, but this is also an area of the plot that many present-day Danes call home (not shown, because I don't have any suitable academic Danish samples to run).

I'll eat my hat if it turns out that Scandinavia experienced a major population shift (say, more than a collateral ~10%) during the LN and/or BA periods. And I'll post a clip of it online too.

Update 27/08/2019: Four of the samples from the recent Frei et al. paper on human mobility in prehistoric southern Scandinavia are in my Global25 datasheets. So I thought it might be interesting to check whether their strontium isotope ratios correlated with their genomic profiles.

In the Principal Component Analysis (PCA) below, RISE61 is a subtle outlier along the horizontal axis compared to the other three Nordic ancients, as well as a Danish individual representative of the present-day Danish gene pool. Also note that RISE61 shows the most unusual strontium isotope ratio (0.712588). The PCA was run with an online tool freely available here.


To help drive the point home, here's a figure from Frei et al., edited by me to show the positions of RISE47, RISE61 and RISE71. If RISE276 was also in this graph, he'd be sitting well under the "local" baseline, in roughly the same spot along the vertical axis as RISE47.


Interestingly, RISE61 belongs to Y-chromosome haplogroup R1a-M417, while RISE47 and RISE276, who appear to have been locals, both belong to R1b-M269. My guess is that RISE61 was a recent migrant from a more northerly part of Scandinavia dominated by the Battle-Axe culture (BAC). The BAC population was probably rich in R1a-M417 because it moved into Scandinavia from the Pontic-Caspian steppe via the East Baltic. This is what Frei et al. say about RISE61 and his burial site:

The double passage grave of Kyndeløse (Fig 1, S1 File) located on the island of Zealand yielded 70 individuals as well as a large number of grave goods, including flint artefacts, ceramics, and tooth and amber beads. We conducted strontium isotope analyses of seven individuals from Kyndeløse encompassing a period of c. 1000 years, indicating the prolonged use of this passage grave. The oldest of the seven individuals is a female (RISE 65) from whom we measured a “local” strontium isotope signature ( 87 Sr/ 86 Sr = 0.7099). Similar values were measured in five other individuals, including adult males and females. Only a single individual from Kyndeløse, an adult male (RISE 61) yielded a somewhat different strontium isotope signature of 87 Sr/ 86 Sr = 0.7126 which seems to indicate a non-local provenance. The skull of this male individual revealed healed porosities in the eye orbits, cribra orbitalia, a condition which is possibly linked to a vitamin deficiency during childhood, such as iron deficiency.

By the way, RISE47 was buried in a flat grave, which suggests that he was a commoner. RISE276 was found in a peat bog in Trundholm, where the famous Trundholm sun chariot was discovered (see here). He may have been a human sacrifice.

Citation...

Frei KM, Bergerbrant S, Sjögren K-G, Jørkov ML, Lynnerup N, Harvig L, et al. (2019) Mapping human mobility during the third and second millennia BC in present-day Denmark. PLoS ONE 14(8): e0219850. https://doi.org/10.1371/journal.pone.0219850

See also...

They came, they saw, and they mixed

Children of the Divine Twins

The mystery of the Sintashta people

Friday, May 3, 2019

Inferring the linguistic affinity of long dead and non-literate peoples: a multidisciplinary approach


Ancient DNA has treated us to many surprises in recent years. But it has also uncannily corroborated some well established hypotheses that were formulated decades ago from historical linguistics and archeological data. One such hypothesis is that the population associated with the Late Neolithic Corded Ware culture (CWC), and its myriad offshoots, spoke early Indo-European languages and spread them across much of Europe and into the Indian subcontinent.

Below is a series of figures in which I explain why the CWC and its likely close relative, the Sintashta culture, are widely regarded as early Indo-European-speaking cultures, even though their languages aren't attested. To view the images at their maximum size, right click on the thumbs and choose "open link in a new tab".


It's a damn shame that we still don't know where the modern domesticated horse lineage ultimately came from. I'm pretty sure that it came from the Pontic-Caspian steppe, but I was hoping this would be confirmed in the latest paper on horse genomics published today at Current Biology: Tracking Five Millennia of Horse Management with Extensive Ancient Genome Time Series. Nope, the topic wasn't even covered, and no wonder, because the sampling strategy in the paper didn't allow it to be. What we desperately need are samples associated with such archeological cultures as Khvalynsk, Repin, Sredny Stog and Yamnaya. Maybe next time, eh?

See also...

Monday, December 3, 2018

On the trail of the Proto-Uralic speakers (work in progress)


Historical linguists have long posited that Fennoscandia was a busy contact zone between early Germanic and Uralic languages. The first ancient DNA samples from what is now Finland have corroborated their inferences, by showing that during the Iron Age the western part of the country was inhabited by a genetically heterogeneous population closely related to both the Uralic-speaking Saami and Germanic-speaking southern Scandinavians.

The samples were sequenced and analyzed by two different teams of researches, and their findings published recently in Lamnidis et al. and Sikora et al. (see here and here, respectively).

This is how most of these ancients, whose remains were excavated from the Levanluhta burial site dated to 300–800 CE, behave in a Principal Component Analysis (PCA) based on my Global25 data. Levanluhta_IA are the Saami-related samples, while Levanluhta_IA_o is an Scandinavian-like outlier. Baltic_IA is an Iron Age individual from what is now Lithuania from the recent Damgaard et al. paper (see here). Note the accuracy of the Global25 data in pinpointing their genetic affinities and also the trajectory of the Levanluhta_IA cluster, which seems to be "pulling" towards Levanluhta_IA_o.


The Saami and Levanluhta_IA are clear outliers from the main Northern European cluster. There are two reasons for this: excess East Asian/Siberian-related ancestry and Saami-specific genetic drift. However, this eastern admixture and genetic drift are shared in varying degrees by other North European populations, especially those that also speak Uralic languages, and this is why they appear to be "pulling" towards the Saami/Levanluhta_IA clusters in my PCA. Thus, what this suggests is that the expansion of Uralic languages across Northeastern Europe was intimately linked with the spread of Siberian-related ancestry into the region.

This idea has been around for a long time and is now becoming even more widely accepted (see here). However, Lamnidis et al. also featured samples from a likely pre-Uralic (1523±87 calBCE) burial site at Bolshoy Oleni Ostrov in the Kola Peninsula, present-day northern Russia, and, perhaps surprisingly, found that they showed even more Siberian-related ancestry than Levanluhta_IA. So what's going on?

I'm confident that this discrepancy can be explained by multiple waves of migrations from the east into Northeastern Europe, possibly before, during and after the time of the people buried at Bolshoy Oleni Ostrov, by pre-Uralic, para-Uralic and/or Proto-Uralic-speaking populations.

Consider the following qpAdm output, in which Levanluhta_IA is just barely modeled successfully as a two-way mixture between Levanluhta_IA_o and Bolshoy_Oleni_Ostrov. The statistical fit improves significantly with the addition of Glazkovo_EBA as a third mixture source. This is an ancient population from near Lake Baikal dated to 4597-3726 BC from the aforementioned Damgaard et al. paper.

Levanluhta_IA
Bolshoy_Oleni_Ostrov 0.468±0.036
Levanluhta_IA_o 0.532±0.036
chisq 19.129
tail prob 0.0854706
Full output

Levanluhta_IA
Bolshoy_Oleni_Ostrov 0.241±0.092
Glazkovo_EBA 0.162±0.059
Levanluhta_IA_o 0.597±0.046
chisq 7.756
tail prob 0.734966
Full output

For the sake of being complete, I also tested whether Levanluhta_IA_o could be substituted by other similar ancient samples from the neighborhood, including those associated with the Battle-Axe and Corded Ware cultures. There's not much to report; qpAdm returned poor statistical fits and/or implausible ancestry proportions (for the full output from my runs, see here). Baltic_IA did produce a statistically sound model, but with excess Glazkovo_EBA-related ancestry. I also had to drop Bolshoy_Oleni_Ostrov from the analysis to make things work, which suggests to me that the result shouldn't be taken too literally.

Levanluhta_IA
Baltic_IA 0.677±0.034
Glazkovo_EBA 0.323±0.034
chisq 8.547
tail prob 0.741095
Full output

So as far as I can see, the western ancestry in Levanluhta_IA is likely to be mostly of Germanic origin, and thus Indo-European, meaning that it's logical to look east, perhaps far to the east, for the source of its Uralic ancestry. This might seem like a complicated and uncertain task, considering that Levanluhta_IA could well be at least a thousand years younger than the first entry of Uralic speakers into Fennoscandia. However, take a look what happens when I substitute Glazkovo_EBA with a variety of Uralic-speaking populations from around the Ural Mountains, which is where the Proto-Uralic homeland is generally considered to have been located.

Levanluhta_IA
Bolshoy_Oleni_Ostrov 0.210±0.091
Khanty 0.283±0.090
Levanluhta_IA_o 0.507±0.035
chisq 7.007
tail prob 0.798532
Full output

Levanluhta_IA
Bolshoy_Oleni_Ostrov 0.193±0.098
Levanluhta_IA_o 0.495±0.035
Mansi 0.312±0.100
chisq 7.884
tail prob 0.7237
Full output

Levanluhta_IA
Bolshoy_Oleni_Ostrov 0.300±0.065
Levanluhta_IA_o 0.337±0.072
Mari 0.363±0.121
chisq 8.393
tail prob 0.677705
Full output

Levanluhta_IA
Bolshoy_Oleni_Ostrov 0.238±0.084
Levanluhta_IA_o 0.553±0.036
Nenets 0.209±0.067
chisq 7.210
tail prob 0.78181
Full output

Levanluhta_IA
Bolshoy_Oleni_Ostrov 0.302±0.069
Levanluhta_IA_o 0.324±0.081
Udmurt 0.373±0.135
chisq 9.195
tail prob 0.60393
Full output

All of these models look great, and easily rival the best model with Glazkovo_EBA. Moreover, they make good sense in terms of linguistics. The only problem is that they're anachronistic, because the Uralic-speaking reference populations are younger than Levanluhta_IA. So I can't be certain that they reflect reality without corroboration from ancient DNA. It might turn out, for instance, that a Glazkovo_EBA-like population was already present somewhere deep in Europe before or during the time of Bolshoy_Oleni_Ostrov, while no such population existed around the Ural Mountains until the time of Levanluhta_IA.

By the way, it might be important to note that the present-day Finnish samples in my dataset can't be modeled as a mixture between Levanluhta_IA and Levanluhta_IA_o. But they can be modeled as a mixture between Baltic_IA and Levanluhta_IA. I don't know which part of Finland they're from exactly; probably all over the place, so it'd be useful to test regional Finnish populations to see how they behave in such models. Of course, Finns aren't Saamic speakers, they're Finnic speakers, and they're probably the result of a more recent Uralic expansion into Fennoscandia than the one that gave rise to the Saami.

Finnish
Baltic_IA 0.671±0.076
Levanluhta_IA 0.329±0.076
chisq 14.114
tail prob 0.293508
Full output

Damgaard et al. didn't report the Y-haplogroup for Baltic_IA, but the word round the campfire is that this individual belonged to N1c, which is today the most common Y-haplogroup among Uralic speakers. Obviously, we need a lot more ancient DNA to sort all of this out, but things are already looking pretty much as expected. Stay tuned for new posts in this series following the publication of more ancient DNA relevant to this fascinating topic.

See also...

How did Y-haplogroup N1c get to Bolshoy Oleni Ostrov?

The Uralic cline in the Global25

Late PIE ground zero now obvious; location of PIE homeland still uncertain, but...

Saturday, September 22, 2018

Corded Ware people =/= Proto-Uralics (Tambets et al. 2018)


A new paper on the genetic structure of Uralic-speaking populations has appeared at Genome Biology (see here). It looks to me like the prelude to a forthcoming paleogenetics paper on the same topic that was discussed in the Estonian media recently (see here). Although not exactly ground breaking (because it basically argues what I've been saying at this blog for years, like here), it's a very nice effort all round and must be read by anyone with an interest in this topic. From the paper, emphasis is mine:

Background The genetic origins of Uralic speakers from across a vast territory in the temperate zone of North Eurasia have remained elusive. Previous studies have shown contrasting proportions of Eastern and Western Eurasian ancestry in their mitochondrial and Y chromosomal gene pools. While the maternal lineages reflect by and large the geographic background of a given Uralic-speaking population, the frequency of Y chromosomes of Eastern Eurasian origin is distinctively high among European Uralic speakers. The autosomal variation of Uralic speakers, however, has not yet been studied comprehensively.

Results: Here, we present a genome-wide analysis of 15 Uralic-speaking populations which cover all main groups of the linguistic family. We show that contemporary Uralic speakers are genetically very similar to their local geographical neighbours. However, when studying relationships among geographically distant populations, we find that most of the Uralic speakers and some of their neighbours share a genetic component of possibly Siberian origin. Additionally, we show that most Uralic speakers share significantly more genomic segments identity-by-descent with each other than with geographically equidistant speakers of other languages. We find that correlated genome-wide genetic and lexical distances among Uralic speakers suggest co-dispersion of genes and languages. Yet, we do not find long-range genetic ties between Estonians and Hungarians with their linguistic sisters that would distinguish them from their non-Uralic-speaking neighbours.

Conclusions: We show that most Uralic speakers share a distinct ancestry component of likely Siberian origin, which suggests that the spread of Uralic languages involved at least some demic component.

...
Recent aDNA studies have shown that extant European populations draw ancestry form three main migration waves during the Upper Palaeolithic, the Neolithic and Early Bronze Age [2, 3, 45]. The more detailed reconstructions concerning NE Europe up to the Corded Ware culture agree broadly with this scenario and reveal regional differences [65–67]. However, to explain the demographic history of extant NE European populations, we need to invoke a novel genetic component in Europe—the Siberian. The geographic distribution of the main part of this component is likely associated with the spread of Uralic speakers but gene flow from Siberian sources in historic and modern Uralic speakers has been more complex, as revealed also by a recent study of ancient DNA from Fennoscandia and Northwest Russia [68]. Thus, the Siberian component we introduce here is not the perfect but still the current best candidate for the genetic counterpart in the spread of Uralic languages.


Citation...

Tambets et al., Genes reveal traces of common recent demographic history for most of the Uralic-speaking populations, Genome Biology, (2018) 19:139 https://doi.org/10.1186/s13059-018-1522-1

See also...

Big deal of 2019: ancient DNA confirms the link between Y-haplogroup N and Uralic expansions

Sunday, September 16, 2018

Celtic vs Germanic Europe


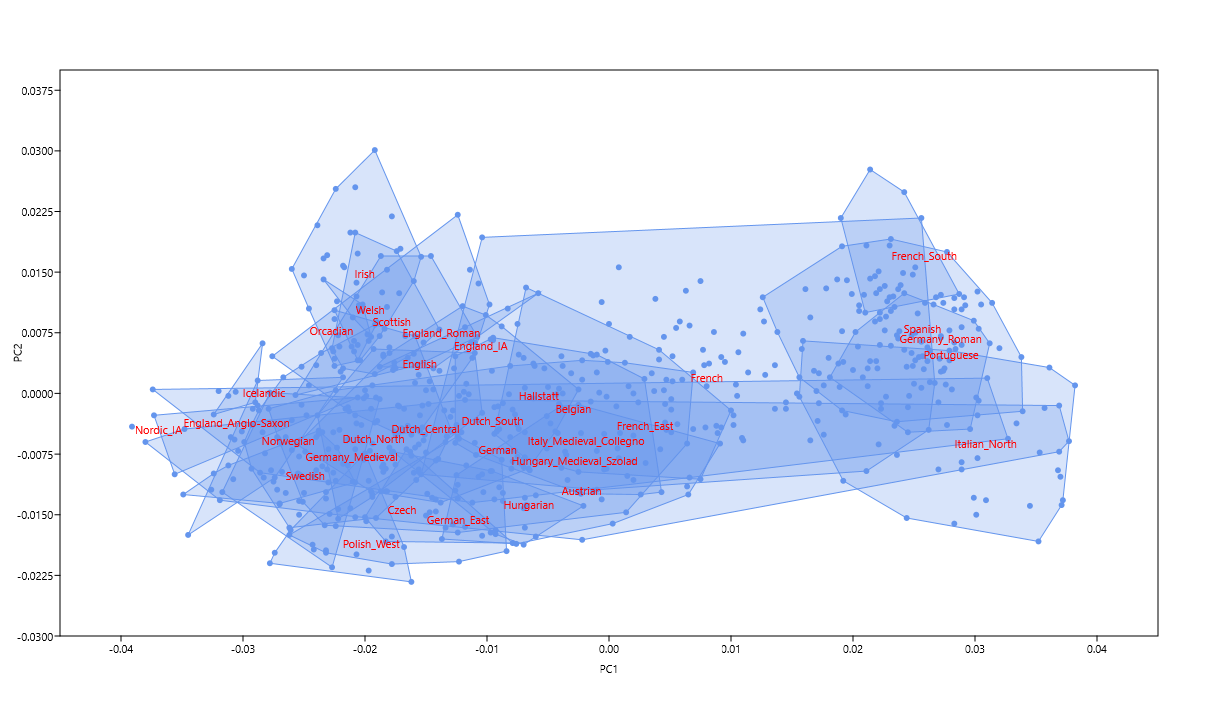
I have a feeling that ancient DNA from post-Bronze Age Northwestern Europe will be coming thick and fast from now on. To get the most out of such data I've designed a new Principal Component Analysis (PCA) that does a better job of separating the Celtic- and Germanic-speaking populations of Europe than my previous efforts of this sort (see here and here). Below are two different versions of the same PCA. The relevant datasheet is available here.

And here's a Discrimination Analysis (LDA) plot based on the 25 principal components. It further differentiates many of the populations along the east > west cline of genetic diversity.


The difference between the Germanic Anglo-Saxons and the Celtic and Roman Britons of what is now eastern England is obvious. The Anglo-Saxons could pass for Scandinavians, while the Celts and Romans both cluster between the Irish and French. This makes good sense, and is exactly what I was looking for. It's also interesting to see the presumably Celtic-speaking Hallstatt samples from Bylany, Czechia, clustering with the Belgians.

Update 14/12/2019: Pictured below is a new version of my Celtic vs Germanic genetic map. It's based on the same Principal Component Analysis (PCA) as the original, but more focused on Northwestern Europe and produced with a different program.


To see the interactive online version, navigate to Vahaduo Custom PCA and copy paste the text from here into the empty space under the PCA DATA tab. Then press the PLOT PCA button under the PCA PLOT tab. For more guidance, refer to the screen caps here and here.

To include a wider range of populations in the key, just edit the data accordingly. For instance, to break up the ancient grouping into more specific populations, delete the Ancient: prefix in all of the relevant rows. This is what you should see:


Conversely, you can leave the ancient sample set intact and instead reorder the present-day linguistic groupings into, say, geographic groupings. To achieve this just delete all of the linguistic prefixes, such as Celtic:, Germanic:, and so on. You should end up with a datasheet like this and plot like this.

Of course, you can design your own plot by using any combination of the ancient and present-day individuals and populations that I've already run in this PCA. Their coordinates are listed here. Indeed, if you're in the possession of your own Celtic vs Germanic PCA coordinates, you can add yourself to the plot. And if you're not, see here.

It's also possible to re-process PCA data via the SOURCE tab. But I don't recommend doing this with the Celtic vs Germanic data, which are derived from a fine scale analysis and don't pack much variation. On the other hand, Global25 data are ideal for such re-processing. I made the plots below from subsets of Global25 coordinates available in a zip file here. To see how, refer to the screen caps here and here.


See also...

Modeling your ancestry has never been easier

Getting the most out of the Global25

Modeling genetic ancestry with Davidski: step by step

Tuesday, September 26, 2017

The beast among Y-haplogroups


A lot has been written about Y-haplogroup R1a over the years. Sadly, most of it was wrong, such as its posited Pleistocene origin in the Indian subcontinent and subsequent migration to Europe.

In all likelihood, R1a was born somewhere in North Eurasia. More importantly, its R1a-M417 subclade, which encompasses almost 100% of modern-day R1a lineages, no doubt came into existence somewhere on the Pontic-Caspian (or Western) steppe in what is now Ukraine and southern Russia just 7,000-6,000 years ago.

And within a couple of thousand years it expanded in almost all directions, probably on the back of the early Indo-European dispersals (see here), to cover a massive range from Scandinavia to South Asia. It is the beast among Y-haplogroups.


The most common subclade of R1a-M417 in South Asia today is R1a-Z93, and, realistically, it couldn't have arrived there earlier than about 2,000BC. So much for the Pleistocene.

See also...

Y-haplogroup R1a and mental health

The Poltavka outlier

Yamnaya isn't from Iran just like R1a isn't from India