search this blog

Showing posts with label qpGraph. Show all posts

Tuesday, December 29, 2020

Fully automated graph exploration


Scientists at Broad MIT are working on a new feature-packed and "lightning fast" version of Admixtools that runs in R. It's already available via this link...

uqrmaie1.github.io/admixtools

I don't have access to a Linux machine right now, but since this thing runs in R then it also runs in Windows, and I do have a Windows computer here.

One of the most interesting and useful features in the new R package is arguably the find_graphs function, which automatically searches for admixture graphs that reflect the observed f-statistics. That is, once the user chooses the samples and settings, find_graphs runs an unsupervised admixture graph analysis.

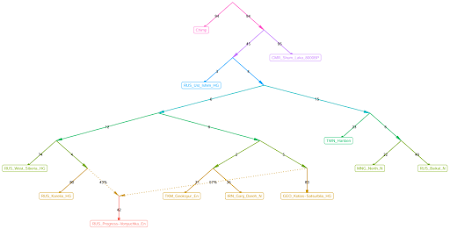
Here are a couple of graphs that I knocked out with find_graphs in about five minutes each. The commands and settings that I used are listed in a text file here.


The two topologies above were among the most commonly seen in a series of about 50 runs with the same sample set. A couple of basic inferences based on the output:

- RUS_Progress-Vonyuchka_En harbors GEO_Kotias-Satsurblia_HG-related ancestry, not IRN_Ganj_Dareh_N-related ancestry

- IRN_Ganj_Dareh_N and TKM_Geoksyur_En form a clade to the exclusion of GEO_Kotias-Satsurblia_HG.

The results are certainly in line with those from other types of analyses that I've done on this blog (for instance, see here and here).

Update 05/01/21: Robert Maier, one of the creators of Admixtools2, has left this message in the comments below.

I'm glad to see that there is so much interest in Admixtools2! I very much appreciate any comments and suggestions on how to improve it and how to make it more user friendly.

Because it's still under active development, some things are likely to change in the future. For example, there is a faster successor to "find_graphs", called "find_graphs2", but in the future they will probably be merged into one.

I'm in David Reich’s group at Harvard and Broad and we are hoping to publish a paper describing Admixtools2 where we illustrate its value by using it to test how robust several previously published results are by exploring a large number of alternative models for each of them. If any of you use Admixtools2 to find graphs that are significantly better fits than published graphs and are also historically plausible - or if you find families of graphs that are equally good fits to the published ones but provide qualitatively different conclusions about population relationships - please contact us. That would be a meaningful contribution to the paper we write about this and we’d be open to including someone as a co-author based on identifying case studies like this.
Saturday, June 27, 2020

Major updates to ADMIXTOOLS


An important message from Nick Patterson:

Dear Eurogenes bloggers,

Many of you use ADMIXTOOLS and you might like to know that there is a new release on github [LINK] with some important enhancements.

From the README

*** NEW ***

1)

Version 7.0 has numerous upgrades.

a) Two new executables --qpfstats qpfmv allow precomputation of f-statistic basis. This can greatly reduce computation costs.
b) qpAdm, qpWave, qpGraph support qpfstats output as input.
*** This is a much improved way of running with allsnps: YES. ***
c) A new experimental feature of qpGraph (halfscore: YES) allows comparison of 2 phylogenies + a (weak) goodness of fit score. Be careful if running with a large number of populations and consider reducing block size say blgsize: .005

2)

Note that several of the new ideas implemented in version 7.0 were developed collaboratively with Robert Maier, who has implemented them along with the great majority of other ADMIXTOOLS functionality in R: See https://github.com/uqrmaie1/admixtools
Executables run fast, and it has features not available in this C version, such as interactive exploration of graph phylogenies.
A manuscript describing the algorithmic ideas and providing documentation of the methods is in preparation.

qpfstats is the most important new executable. This estimates f-statistics and covariance on a basis.

a) This can be passed into other programs of the package without having to reaccess the genotype files, greatly speeding the computations.
b) In allsnps: YES mode a new computation is carried out (explained in qpfs.pdf) that is much more logical when there is a lot of missing data. Sometimes standard errors are greatly reduced.
qpfstats can be used with up to 30 populations. Much beyond that the output files become large.

As usual there may be bugs...

Nick Patterson 6/27/2020

Update 29/06/2020: As pointed out above, qpfstats is the most important new executable. Indeed, Nick Patterson now recommendeds that qpAdm analyses run with the allsnps: YES flag should be based on qpfstats output.

Several of my recent blog posts featured qpAdm models run with the allsnps: YES flag, but they were based on genotype data because obviously I didn't know anything about qpfstats at the time.

So I went back and ran some of these models again, just to make sure that they were still relevant. Below are three examples which you can compare to the original analyses here, here and here, respectively.

TUR_Arslantepe_LC_Maykop
RUS_Maykop_Novosvobodnaya 0.281±0.042
TUR_Arslantepe_LC 0.719±0.042
chisq 10.923
tail prob 0.449752
Full output

TUR_Barcin_C
RUS_Vonyuchka_En 0.137±0.031
TUR_Buyukkaya_EC 0.863±0.031
chisq 15.074
tail prob 0.0889099
Full output

UKR_N_admixed
RUS_Progress_En 0.083±0.020
UKR_N 0.917±0.020
chisq 6.825
tail prob 0.65538
Full output

As far as I can tell, they're very similar to the original runs, which is a relief, because it means that the conclusions in my blog posts still make sense.

Monday, January 20, 2020

Graphing the truth


I haven't used TreeMix since qpGraph became freely available for Linux. Among other things, the latter offers greater control, reproducibility and transparency.

However, I'd say that in its current form qpGraph is not the most objective way to analyze data. That's because if you're really good with it, and you want a graph to work, then often you can make it work by tweaking whatever it is that needs to be tweaked.

It's not possible to do a lot of tweaking with TreeMix. Indeed, once the user picks the samples for the TreeMix run, the rest of the process can be totally unsupervised, and thus free from human interference. Obviously, that's not a guarantee of accuracy, but it can be useful.

I feel I need to run more unsupervised analyses, especially when exploring new data. So to that end, I've dusted off TreeMix and will be using it regularly again.

There's been some talk lately online about migrations from Central Asia giving rise to the Eneolithic populations of the North Caucasus Piedmont steppe. In my opinion, that sounds like nonsense. But let's see what TreeMix has to say on the matter. In the graphs below look for the samples labeled Progress_En and Vonyuchka_En, respectively.


As far as I can tell, both of these graphs essentially corroborate the results from my recent Principal Component Analyses (PCA) with many of the same ancients (see here). In other words, Progress_En and Vonyuchka_En can be described as mixtures of populations closely related to the hunter-gatherers of the Caucasus on one hand, and those of Eastern Europe on the other. How does Central Asia fit into this, you might ask? It doesn't, unless you really want it to.

See also...

Did South Caspian hunter-fishers really migrate to Eastern Europe?