search this blog

Showing posts with label admixture. Show all posts

Thursday, September 1, 2022

Dear Iosif #3


Back in 2016 I made this prediction about the origins of the Yamnaya people (Steppe_EMBA):

But here's my prediction: Steppe_EMBA only has 10-15% admixture from the post-Mesolithic Near East not including the North Caucasus, and basically all of this comes via female mediated gene flow from farming communities in the Caucasus and perhaps present-day Ukraine.

The relevant blog post is still here. Looking back, my analysis is a bit sloppy and I didn't articulate my ideas too well. But that was a pretty good prediction for its time, and I believe it still has a chance of being confirmed, more or less.

On the other hand, the widely publicized hypothesis that the Yamnaya population is a ~50/50 mixture between indigenous Eastern European hunter-gatherers and Near Eastern or West Asian migrants never looked right to me. So I'm glad that it's now dead and buried.

Those of you not up to date with this topic, all you need to know is that the Yamnaya genotype existed in Eastern Europe at least a thousand years before Yamnaya, and, moreover, the Yamnaya people are largely derived from Eastern European foragers already rich in Near Eastern-related ancestry. The relevant ancient genomes are on the way (for instance, see here).

Nevertheless, the narrative that waves of Near Eastern migrants moved into prehistoric Eastern Europe, leading to the emergence of the Yamnaya culture and even the Proto-Indo-European language, is still being pushed by some notable scientists working with ancient DNA.

My hope is that, considering the latest revelations about the genetic origins of the Yamnaya people, these scientists can embrace a more nuanced view. How about something like this?

- people moved around, and they were especially mobile on the Eastern European steppe from the Eneolithic onwards

- when they made contact they sometimes mixed, so there was admixture between far flung steppe groups

- since population densities on the steppe were low until the Yamnaya period, minor admixture that entered the steppe during the Neolithic and Eneolithic wasn't dilluted easily.

See also...

Dear Iosif #2

But Iosif, what about the Phrygians?

Dear Iosif, about that ~2%

Dear Iosif...Yamnaya

Tuesday, June 21, 2022

My take on the Erfurt Jews


I had a quick look at the genotype data from the recent Waldman et al. preprint focusing on the ancestry of early Jews from Erfurt, Germany. My impression is that the genetic origins of these Jews are somewhat more complex than claimed in the manuscript.

Indeed, I'd say the Waldman et al. characterization of the Erfurt Jews as a three-way mixture between populations similar to present-day Lebanese, South Italians and Russians doesn't exactly reflect reality.

Unlike Waldman et al., I designed an ADMIXTURE analysis that separated East Asian ancestry into East Asian and Siberian clusters, and also included Mediterranean and North African clusters. The output is available in a spreadsheet HERE. Below is a bar graph based on some of the output.
Now, keeping in mind that ADMIXTURE is not a formal mixture test, and that it estimates ancestry proportions from inferred populations, as opposed to ancient groups that actually existed, here are some key observations:

- in terms of fine scale ancestry, the Erfurt Jews show enough variation to be divided into three or four clusters, as opposed to just two as per Waldman et al.

- some of the Erfurt Jews show excess "Mediterranean" ancestry, while others excess "North African" ancestry, and this cannot be explained with ancestral populations similar to Lebanese and/or South Italians, but rather with significant gene flow from the western Mediterranean and possibly North Africa

- several of the Erfurt Jews show relatively high levels of "East Asian" ancestry that cannot be explained by admixture from Russians, or even any Russian-like populations, because such populations almost lack this type of ancestry, and instead show significant "Siberian" admixture

- as far as I can see, there are no correlations between any of the observations above and the quality of the samples. That is, low coverage doesn't appear to be causing the aforementioned excess "Mediterranean", "North African" and/or "East Asian" ancestry proportions.

Investigating this in more detail with, say, formal statistics will take some time. But I was able to reproduce the results from the above ADMIXTURE run using several somewhat different datasets, so that's something.

It seems to me that Waldman et al. want a simple and elegant model to explain the data, which is understandable, but I do think they should at least expand their ADMIXTURE analysis to include "Siberian", "Mediterranean" and "North African" clusters, and go from there depending on what they find.

Citation...

Waldman et al., Genome-wide data from medieval German Jews show that the Ashkenazi founder event pre-dated the 14th century, bioRxiv, posted May 16, 2022, doi: https://doi.org/10.1101/2022.05.13.491805

See also...

Mediterranean PCA update

Tuesday, January 11, 2022

Population genetics is a state of mind


Years of blogging about population genetics has seriously eroded my faith in the peer review process.

During the past decade I've witnessed an inordinate amount of crap published in basically all of the major science journals. Often the work is misguided in some way, sometimes even quite strange, and occasionally outright wrong.

Back in 2014, a team of scientists from the UK published a paper in Science emphatically titled A Genetic Atlas of Human Admixture History. These people were Garrett Hellenthal, George B. J. Busby, Gavin Band, James F. Wilson, Cristian Capelli, Daniel Falush, and Simon Myers. See here.

The thing that really sticks out for me in this paper is Figure 3, which shows the present-day Polish population as largely a mixture between Northern European- and Turkish-related ancestries. Incredibly, the Turkish-related ratio appears to be about 25% and dated to 438 CE.

This is not just inexplicable, but utterly wrong. It's a result that is impossible to reproduce with any standard population genetics methods.

In fact, in terms of deep ancient ancestry, present-day Poles are very similar to present-day Scandinavians, and even to Viking Age, Iron Age and Bronze Age Scandinavians. This is easy to demonstrate, for instance, with f4-statistics, in part based on samples from the Hellenthal et al. paper.

Chimp Yamnaya_Samara Swedish_modern Polish_modern -0.000311 -1.574
Chimp Yamnaya_Samara Ollsjo_Bronze_Age Polish_modern -0.000044 -0.152
Chimp Yamnaya_Samara Sealand_Iron_Age Polish_modern -0.000072 -0.293
Chimp Yamnaya_Samara Sealand_Viking_Age Polish_modern 0.000078 0.525
Chimp Yamnaya_Samara Gotland_Viking_Age Polish_modern -0.000141 -1.322

Chimp Barcin_N Swedish_modern Polish_modern -0.000318 -1.662
Chimp Barcin_N Ollsjo_Bronze_Age Polish_modern 0.000216 0.798
Chimp Barcin_N Sealand_Iron_Age Polish_modern -0.000023 -0.104
Chimp Barcin_N Sealand_Viking_Age Polish_modern -0.000186 -1.310
Chimp Barcin_N Gotland_Viking_Age Polish_modern 0.000083 0.788

Chimp Karelia_HG Swedish_modern Polish_modern -0.000134 -0.540
Chimp Karelia_HG Ollsjo_Bronze_Age Polish_modern 0.000056 0.162
Chimp Karelia_HG Sealand_Iron_Age Polish_modern 0.000047 0.153
Chimp Karelia_HG Sealand_Viking_Age Polish_modern 0.000424 2.241
Chimp Karelia_HG Gotland_Viking_Age Polish_modern 0.000134 0.959

Simply put, if Poles have ~25% ancestry from a Turkish-related source, then so do Swedes, Norwegians and basically all other Northern Europeans going back hundreds and even thousands of years. This is obviously not the case, and it's also not what Hellenthal et al. claimed anyway.

A year later, a team of scientists that again included Garrett Hellenthal, George B. J. Busby, James F. Wilson, Cristian Capelli and Simon Myers, published another, similar paper in Current Biology. And guess what? This paper also claimed that present-day Poles had Turkish-related ancestry, but this time dating to a somewhat later period. See Busby et al. 2015 Figure 4.C here.

I've got most of the samples from that paper, so I can analyze them myself, and I think I know what the problem is. Basically, the Turks are mixed. So what appears to have happened is that Busby et al. got things backwards.

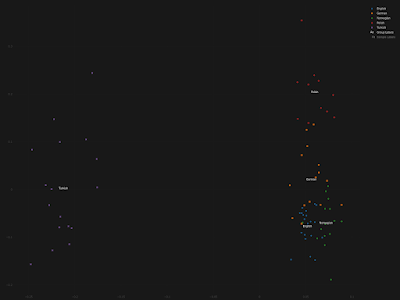
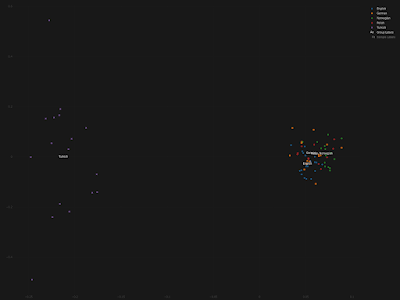
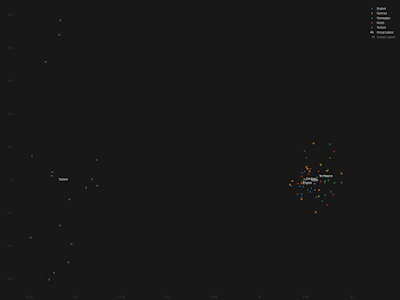
Below are three plots from a Principal Component Analysis (PCA) largely based on data from Busby et al., featuring samples from England, Germany, Norway, Poland and Turkey. The first plot is based on dimensions 1 and 2, the second plot on dimensions 1 and 3, and the third plot on dimensions 1 and 4. The relevant data file is available here.

Note that the Europeans are more or less symmetrically related to the Turks, which means none of these European populations has significantly more Turkish-related ancestry than the others. Indeed, it's the Turks who show more variation in the first (horizontal) dimension, suggesting that they might have variable levels of European ancestry.


I chose the aforementioned papers to make my point here because they made quite an impression on me. In other words, they really pissed me off.

For the sake of completeness, I'm now going to try and get in touch with the authors and ask them how on earth they managed to make these Poles Turkish-related, and also why they never corrected their mistake.

See also...

Don't believe everything you read in peer reviewed papers

Sunday, January 17, 2021

That old chestnut: Northeast vs Northwest Euros


In the last comment thread reader Greg put forth this question:

David, when are you going to explain the genetic discrepancy between Northeastern and Northwestern Europeans? You know, the one that people believe is due to Baltic Hunter-Gatherer admixture, whereas you believe it is due to genetic drift? You ought to make a post about this issue at some point, because a lot of people are wondering what's causing the differences.

Well, Greg, this issue has been discussed to the proverbial death here and elsewhere. In fact, there were two posts and rather lengthy comment threads on the same topic at this blog just a few months ago. See here and here.

Nevertheless, it seems that a fair number of people are still befuddled, so I'm going to try to explain this one last time, as briefly as a I can using just a handful of f4-stats.

Admittedly, Northeast Europeans generally do pack higher levels of indigenous European hunter-gatherer ancestry than Northwest Europeans. This is especially true of Balts, who show more of this type of ancestry than even Scandinavians in practically every type of analysis.

The f4-stats below back this up unambiguously. Note the significantly positive (>3) Z scores, which suggest that Latvians and Lithuanians harbor more Baltic hunter-gatherer-related ancestry than Norwegians and Swedes.

Chimp Baltic_HG Norwegian Latvian 0.001301 7.114
Chimp Baltic_HG Swedish Latvian 0.001017 4.205
Chimp Baltic_HG Norwegian Lithuanian 0.001023 7.341
Chimp Baltic_HG Swedish Lithuanian 0.000763 3.408

Greg, I know what you're thinking: the naysayers are right! But wait, because there's a twist to this tale. Check out these f4-stats:

Chimp Baltic_HG Norwegian Belarusian 0.000265 1.934
Chimp Baltic_HG Swedish Belarusian 0.000152 0.7
Chimp Baltic_HG Norwegian Polish 6.4E-05 0.519
Chimp Baltic_HG Swedish Polish -0.000235 -1.074

Please note, Greg, that none of the Z scores reach significance, which means that these Northwest Europeans and Slavs are symmetrically related to Baltic_HG. They're also symmetrically related to other relevant ancient groups such as the Yamnaya steppe herders. This, of course, suggests that they harbor very similar levels of basically the same ancient genetic components.

Chimp Karelia_HG Norwegian Belarusian 0.000136 0.844
Chimp Karelia_HG Swedish Belarusian 7.9E-05 0.32
Chimp Karelia_HG Norwegian Polish -4.7E-05 -0.304
Chimp Karelia_HG Swedish Polish -0.000134 -0.54

Chimp Yamnaya_Samara Norwegian Belarusian -0.000134 -1.085
Chimp Yamnaya_Samara Swedish Belarusian -6.6E-05 -0.34
Chimp Yamnaya_Samara Norwegian Polish -0.000225 -1.995
Chimp Yamnaya_Samara Swedish Polish -0.000311 -1.574

Chimp Barcin_N Norwegian Belarusian -0.000335 -2.809
Chimp Barcin_N Swedish Belarusian -0.000284 -1.491
Chimp Barcin_N Norwegian Polish -0.000222 -2.057
Chimp Barcin_N Swedish Polish -0.000318 -1.662

Chimp Baikal_N Norwegian Belarusian 0.000186 1.3
Chimp Baikal_N Swedish Belarusian -7E-05 -0.33
Chimp Baikal_N Norwegian Polish -4.6E-05 -0.351
Chimp Baikal_N Swedish Polish -0.000477 -2.277

Interestingly, pairing up Ukrainians with English samples from Cornwall and Kent produces similar outcomes. But that's because most ancient ancestry proportions in Europe show a closer correlation with latitude than longitude.

Chimp Baltic_HG English_Cornwall Ukrainian 0.000282 2.242
Chimp Baltic_HG English_Kent Ukrainian 0.000225 1.748

Chimp Karelia_HG English_Cornwall Ukrainian 0.000323 2.175
Chimp Karelia_HG English_Kent Ukrainian 0.000239 1.634

Chimp Yamnaya_Samara English_Cornwall Ukrainian -6.6E-05 -0.569
Chimp Yamnaya_Samara English_Kent Ukrainian -0.000112 -0.977

Chimp Barcin_N English_Cornwall Ukrainian -0.000519 -4.641
Chimp Barcin_N English_Kent Ukrainian -0.000598 -5.232

Chimp Baikal_N English_Cornwall Ukrainian 0.000385 2.874
Chimp Baikal_N English_Kent Ukrainian 0.00036 2.836

Now, Greg, if at least in terms of genetic ancestry, Latvians, Lithuanians, Belarusians, Poles and Ukrainians all qualify as Northeast Europeans, then what makes them different, as a group, from Northwest Europeans? Do you believe that the key factor is admixture from Baltic hunter-gatherers? Or is it genetic drift?

Of course, considering all of the f4-stats above, logic dictates that it must be relatively recent genetic drift.

Keep in mind, however, that this only applies to Balto-Slavic speaking Northeast Europeans without significant Uralian ancestry. Overall, Uralic speakers have a more complex population history, and indeed genetic differences between them and Northwest Europeans are in large part due to somewhat different ancestry proportions and also Siberian admixture.

See also...

So who's the most (indigenous) European of us all?

Tuesday, December 29, 2020

Fully automated graph exploration


Scientists at Broad MIT are working on a new feature-packed and "lightning fast" version of Admixtools that runs in R. It's already available via this link...

uqrmaie1.github.io/admixtools

I don't have access to a Linux machine right now, but since this thing runs in R then it also runs in Windows, and I do have a Windows computer here.

One of the most interesting and useful features in the new R package is arguably the find_graphs function, which automatically searches for admixture graphs that reflect the observed f-statistics. That is, once the user chooses the samples and settings, find_graphs runs an unsupervised admixture graph analysis.

Here are a couple of graphs that I knocked out with find_graphs in about five minutes each. The commands and settings that I used are listed in a text file here.


The two topologies above were among the most commonly seen in a series of about 50 runs with the same sample set. A couple of basic inferences based on the output:

- RUS_Progress-Vonyuchka_En harbors GEO_Kotias-Satsurblia_HG-related ancestry, not IRN_Ganj_Dareh_N-related ancestry

- IRN_Ganj_Dareh_N and TKM_Geoksyur_En form a clade to the exclusion of GEO_Kotias-Satsurblia_HG.

The results are certainly in line with those from other types of analyses that I've done on this blog (for instance, see here and here).

Update 05/01/21: Robert Maier, one of the creators of Admixtools2, has left this message in the comments below.

I'm glad to see that there is so much interest in Admixtools2! I very much appreciate any comments and suggestions on how to improve it and how to make it more user friendly.

Because it's still under active development, some things are likely to change in the future. For example, there is a faster successor to "find_graphs", called "find_graphs2", but in the future they will probably be merged into one.

I'm in David Reich’s group at Harvard and Broad and we are hoping to publish a paper describing Admixtools2 where we illustrate its value by using it to test how robust several previously published results are by exploring a large number of alternative models for each of them. If any of you use Admixtools2 to find graphs that are significantly better fits than published graphs and are also historically plausible - or if you find families of graphs that are equally good fits to the published ones but provide qualitatively different conclusions about population relationships - please contact us. That would be a meaningful contribution to the paper we write about this and we’d be open to including someone as a co-author based on identifying case studies like this.

Monday, July 13, 2020

Don't believe everything you read in peer reviewed papers


Case in point, here's a quote from a recent paper at the Journal of Human Genetics (emphasis is mine):

The Mordovian and Csango samples have a moderate to slight orientation toward the Central-Asian and Siberian Turkic groups. This could suggest the more significant East Eurasian or Turkic ancestry of these populations, which should be further investigated. German samples are inhomogeneous, and some of the German samples also show this tendency, which can be the result of the recent 20th century Turkish immigration into Germany [42].

Nope, these German samples don't show anything even remotely resembling recent Turkish ancestry. The authors of the paper, Ádám, V., Bánfai, Z., Maász, A. et al., should've been able to figure this out, even with the standard analyses that they ran. Failing that, the peer reviewers at the Journal of Human Genetics should've noticed that the authors were confused.

Moreover, if the authors and peer reviewers actually bothered to take a closer look at metadata for these samples, which were sourced from the Estonian Biocentre, they'd see that they're not even from Germany. In fact, they represent self-reported ethnic Germans from Russia.

My own quick and dirty analysis of these individuals suggests that many of them harbor East Slavic and/or Volga Finnic ancestries. Indeed, only some of them can pass genetically for run of the mill Germans from Germany. The Principal Component Analysis (PCA) below is self-explanatory. It was plotted with the Vahaduo Custom PCA tools freely available here. The relevant PCA datasheet can be gotten here.


That's not to say, of course, that some Germans don't have recent Turkish ancestry, because an increasing number of Germans nowadays do, nor that people with German heritage in Russia shouldn't identify as Germans, because that's entirely their choice.

This blog post isn't about what it takes to be German, and this is not something that I ever want to discuss for obvious reasons. The point I'm making here is that the authors and peer reviewers of the said paper at the Journal of Human Genetics were sloppy and half-arsed in their approach. And, sadly, this isn't an isolated case in peer reviewed scientific literature dealing with human population genetics.

I feel that the Estonian Biocentre is also partly to blame for this cock up, due to its somewhat peculiar sampling and labelling strategies. For instance, its scientists rely solely on self-reported identity to establish the ethnic origins of their samples, and they apparently never remove genetic outliers from their datasets or even try to identify them.

Unfortunately, I fear that this relaxed approach will eventually lead to basic errors and even unusual conclusions in a number of so called peer reviewed papers.

I first raised this issue with the Estonian Biocentre about five years ago, when I noticed that some of the supposedly Polish individuals in its dataset were genetically more similar to various groups from northern Russia than to Poles from Poland. These individuals also showed significant Siberian ancestry, which was very unusual indeed. Where the hell did the Estonian Biocentre find Poles who resembled people from near the Arctic Circle, you might ask? Apparently in Estonia.

OK, I can imagine that sampling ethnic Poles from Estonia may have been easier for the Estonian Biocentre than sampling Poles from Poland. And Estonian Poles certainly make for interesting and useful data points. However, as you can see in the PCA below, some of these individuals (labeled Polish_Estonia by me) aren't representative of the native Polish population, and yet the Estonian Biocentre not only lumps them with their Poles from Poland, but even labels them with the word "Poland". The relevant PCA datasheet can be gotten here.


However, based on my communications with some of the scientists at the Estonian Biocentre, including head honcho Mait Mestpalu, it seems that nothing will ever change there in regards to this issue. Who knows, perhaps some day we'll see a paper based on Estonian Biocentre data in the Journal of Human Genetics claiming that Poles originated near the Arctic Circle? I wouldn't be shocked if that actually happened.

Citation...

Ádám, V., Bánfai, Z., Maász, A. et al. Investigating the genetic characteristics of the Csangos, a traditionally Hungarian speaking ethnic group residing in Romania. J Hum Genet (2020). https://doi.org/10.1038/s10038-020-0799-6

See also...

Like three peas in a pod

Saturday, June 27, 2020

Major updates to ADMIXTOOLS


An important message from Nick Patterson:

Dear Eurogenes bloggers,

Many of you use ADMIXTOOLS and you might like to know that there is a new release on github [LINK] with some important enhancements.

From the README

*** NEW ***

1)

Version 7.0 has numerous upgrades.

a) Two new executables --qpfstats qpfmv allow precomputation of f-statistic basis. This can greatly reduce computation costs.
b) qpAdm, qpWave, qpGraph support qpfstats output as input.
*** This is a much improved way of running with allsnps: YES. ***
c) A new experimental feature of qpGraph (halfscore: YES) allows comparison of 2 phylogenies + a (weak) goodness of fit score. Be careful if running with a large number of populations and consider reducing block size say blgsize: .005

2)

Note that several of the new ideas implemented in version 7.0 were developed collaboratively with Robert Maier, who has implemented them along with the great majority of other ADMIXTOOLS functionality in R: See https://github.com/uqrmaie1/admixtools
Executables run fast, and it has features not available in this C version, such as interactive exploration of graph phylogenies.
A manuscript describing the algorithmic ideas and providing documentation of the methods is in preparation.

qpfstats is the most important new executable. This estimates f-statistics and covariance on a basis.

a) This can be passed into other programs of the package without having to reaccess the genotype files, greatly speeding the computations.
b) In allsnps: YES mode a new computation is carried out (explained in qpfs.pdf) that is much more logical when there is a lot of missing data. Sometimes standard errors are greatly reduced.
qpfstats can be used with up to 30 populations. Much beyond that the output files become large.

As usual there may be bugs...

Nick Patterson 6/27/2020

Update 29/06/2020: As pointed out above, qpfstats is the most important new executable. Indeed, Nick Patterson now recommendeds that qpAdm analyses run with the allsnps: YES flag should be based on qpfstats output.

Several of my recent blog posts featured qpAdm models run with the allsnps: YES flag, but they were based on genotype data because obviously I didn't know anything about qpfstats at the time.

So I went back and ran some of these models again, just to make sure that they were still relevant. Below are three examples which you can compare to the original analyses here, here and here, respectively.

TUR_Arslantepe_LC_Maykop
RUS_Maykop_Novosvobodnaya 0.281±0.042
TUR_Arslantepe_LC 0.719±0.042
chisq 10.923
tail prob 0.449752
Full output

TUR_Barcin_C
RUS_Vonyuchka_En 0.137±0.031
TUR_Buyukkaya_EC 0.863±0.031
chisq 15.074
tail prob 0.0889099
Full output

UKR_N_admixed
RUS_Progress_En 0.083±0.020
UKR_N 0.917±0.020
chisq 6.825
tail prob 0.65538
Full output

As far as I can tell, they're very similar to the original runs, which is a relief, because it means that the conclusions in my blog posts still make sense.

Monday, January 20, 2020

Graphing the truth


I haven't used TreeMix since qpGraph became freely available for Linux. Among other things, the latter offers greater control, reproducibility and transparency.

However, I'd say that in its current form qpGraph is not the most objective way to analyze data. That's because if you're really good with it, and you want a graph to work, then often you can make it work by tweaking whatever it is that needs to be tweaked.

It's not possible to do a lot of tweaking with TreeMix. Indeed, once the user picks the samples for the TreeMix run, the rest of the process can be totally unsupervised, and thus free from human interference. Obviously, that's not a guarantee of accuracy, but it can be useful.

I feel I need to run more unsupervised analyses, especially when exploring new data. So to that end, I've dusted off TreeMix and will be using it regularly again.

There's been some talk lately online about migrations from Central Asia giving rise to the Eneolithic populations of the North Caucasus Piedmont steppe. In my opinion, that sounds like nonsense. But let's see what TreeMix has to say on the matter. In the graphs below look for the samples labeled Progress_En and Vonyuchka_En, respectively.


As far as I can tell, both of these graphs essentially corroborate the results from my recent Principal Component Analyses (PCA) with many of the same ancients (see here). In other words, Progress_En and Vonyuchka_En can be described as mixtures of populations closely related to the hunter-gatherers of the Caucasus on one hand, and those of Eastern Europe on the other. How does Central Asia fit into this, you might ask? It doesn't, unless you really want it to.

See also...

Did South Caspian hunter-fishers really migrate to Eastern Europe?

Sunday, November 10, 2019

Etruscans, Latins, Romans and others


I've just added coordinates for more than 100 ancient genomes from the recently published Antonio et al. ancient Rome paper to the Global25 datasheets. Look for the population and individual codes listed here. Same links as always:

Global25 datasheet ancient scaled

Global25 pop averages ancient scaled

Global25 datasheet ancient

Global25 pop averages ancient

Thus far I've only managed to check a handful of the coordinates, so please let me know if you spot any issues. Below is a Principal Component Analysis (PCA) featuring the Etruscan and Italic speakers. I ran the PCA with an online tool specifically designed for Global25 coordinates freely available here.


Can we say anything useful about the origins of the Etruscan and early Italic populations thanks to these new genomes? Also, to reiterate my question from the last blog post, what are the genetic differences exactly between the Etruscans, early Latins, Romans and present-day Italians? Feel free to let me know in the comments below.

Update 13/11/2019: Here's another, similar PCA. This one, however, is based on genotype data, and it also highlights many more of the samples from the Antonio et al. paper. Considering these results, I'm tempted to say that the present-day Italian gene pool largely formed in the Iron Age, and that it was only augmented by population movements during later periods. The relevant datasheet is available here.


Update 13/11/2019: It seems to me that the two Latini-associated outliers show significant ancestry from the Levant, which possibly means that they're in part of Phoenician origin. These qpAdm models speak for themselves:

ITA_Ardea_Latini_IA_o
ITA_Proto-Villanovan 0.547±0.081
Levant_ISR_Ashkelon_IA2 0.453±0.081
chisq 7.573
tail prob 0.87027
Full output

ITA_Prenestini_tribe_IA_o
ITA_Proto-Villanovan 0.679±0.068
Levant_ISR_Ashkelon_IA2 0.321±0.068
chisq 7.222
tail prob 0.89033
Full output

The Proto-Villanovan singleton is also a key part of the models. Dating to the Bronze Age/Iron Age transition, she appears to be of western Balkan origin. Moreover, her steppe ancestry is probably derived directly from the Yamnaya horizon.

ITA_Proto-Villanovan
HRV_Vucedol 0.677±0.031
Yamnaya_RUS_Samara 0.323±0.031
chisq 10.397
tail prob 0.661174
Full output

The cluster made up of four early Italic speakers can be modeled with minor Proto-Villanovan-related ancestry, but, perhaps crucially, it doesn't need to be. Indeed, judging by the qpAdm output below, it's possible that almost all of its steppe ancestry came from the Bell Beaker complex, and, thus, the Corded Ware culture complex before that.

ITA_Italic_IA
Bell_Beaker_Mittelelbe-Saale 0.480±0.055
ITA_Grotta_Continenza_CA 0.411±0.042
ITA_Proto-Villanovan 0.109±0.084
chisq 10.294
tail prob 0.590205
Full output

Two out of the three available Etruscans look very similar to the Italic speakers in the above PCA plots, and yet they show a lot more Proto-Villanovan-related ancestry in my qpAdm run. The statistical fit is also relatively poor, perhaps suggesting that something important is missing.

ITA_Etruscan
Bell_Beaker_Mittelelbe-Saale 0.186±0.081
ITA_Grotta_Continenza_CA 0.283±0.064
ITA_Proto-Villanovan 0.531±0.126
chisq 17.175
tail prob 0.143143
Full output

Interestingly, the Etruscan outlier with significant North African admixture (proxied in my run by MAR_LN) doesn't need to be modeled with any Bell Beaker ancestry.

ITA_Etruscan_o
ITA_Proto-Villanovan 0.675±0.057
MAR_LN 0.325±0.057
chisq 14.864
tail prob 0.315912
Full output

Update 17/11/2019: The spatial maps below show how three groups of ancient Romans (from the Imperial, Late Antiquity and Medieval periods) compare to present-day West Eurasian populations in terms of their Global25 coordinates. The hotter the color, the higher the similarity. More here.


See also...

Getting the most out of the Global25

Tuesday, November 5, 2019

Modeling your ancestry has never been easier


An exceedingly simple, yet feature-packed, online tool ideal for modeling ancestry with Global25 coordinates is freely available HERE. It works offline too, after downloading the web page onto your computer. Just copy paste the coordinates of your choice under the "source" and "target" tabs, and then mess around with the buttons to see what happens. The screen caps below show me doing just that.


Another free, easy to use online tool that works with Global25 coordinates is the Principal Component Analysis (PCA) runner HERE. Below is a screen cap of me checking out one of the many PCA that it offers.


See also...

Getting the most out of the Global25

Friday, July 12, 2019

Getting the most out of the Global25


The first thing you need to know about the Global25 is that I update the relevant datasheets regularly, usually every few weeks, but they're always at these links:

Global25 datasheet ancient scaled

Global25 pop averages ancient scaled

Global25 datasheet ancient

Global25 pop averages ancient

...

Global25 datasheet modern scaled

Global25 pop averages modern scaled

Global25 datasheet modern

Global25 pop averages modern

Global25 data for samples from a variety of papers that have been published recently will eventually be incorporated into the main datasheets linked above, but the process might take several weeks or even months. In the meantime, feel free to use the temporary datasheets below. Thanks for your patience.

Allentoft 2023

Chylenski 2023

Jeong 2024

Koptekin 2022

Olalde 2023

Peltola 2022

Penske 2023

Posth 2023

Sirak 2024

Skourtanioti 2023

Stolarek 2023

Varela 2023

Wang 2023

Yu 2023

Each sample has a population code and an individual code. The population codes represent the countries, ethnic groups and/or archeological affinities of the samples, and I often modify these codes to suit my needs. On the other hand, the individual codes are unique to most of the samples and I usually don't change them.

So if you'd like to know more details about the samples try searching for their individual codes via a decent online search engine. Basic information about many of the samples is also available in the "anno" files here.

The main purpose of the Global25 is to provide data for mixture modeling. In other words, for estimating ancestry proportions, both ancient and modern (see here). This can be done on your computer with the R program and the nMonte R script, or online with a couple of different tools, which I discuss below.

If you don't have R installed on your computer, you can get it here, while nMonte is available here. For this tutorial please download nMonte and nMonte3, and store them in your main working folder (usually My Documents).

Once you have R set up, make sure its working directory is the same place where you stored nMonte. You can check this in R by clicking on "File" and then "Change dir". Additionally, you'll need two nMonte input files in the working directory titled "data" and "target". Examples of these files are available here. We'll be using them to test the ancient ancestry proportions of a sample set from present-day England.

Before you can begin the analysis you need to first call the nMonte script by typing or copy pasting source('nMonte.R') into the R console window, and then hitting "enter" on your keyboard. This is what you should see in the R console window afterwards.


To start the mixture modeling process, type or copy paste getMonte('data.txt', 'target.txt') into the R console window, hit "enter", and wait for the results. After a short time, probably less than a minute or two, you should see this output.


The data and target files contain population averages. And, as you can see, the results that these population averages have produced are in line with what one would expect from such a model focusing on the genetic shifts in Northern Europe during the Late Neolithic. Very similar ancient ancestry proportions have been reported for the English and other Northern Europeans recently in scientific literature.

However, when focusing on exceptionally fine-scale genetic variation that isn't reflected too well in the Global25 population averages, a more effective strategy might be to use multiple individuals from each reference population and let nMonte3 aggregate and average the inferred ancestry proportions.

This is often the case when attempting to model ancestry proportions for more recent periods, such as the Middle Ages. So let's try this with the English sample set using a modified data file, which is available here.

Replace the old data file with the new one in your working directory, and, like before, copy paste into the R console window the following two commands, hitting "enter" after each one: source('nMonte3.R') and getMonte('data.txt', 'target.txt'). This is what you should eventually see.


It's difficult to say how accurate these estimates are. But they look more or less correct considering the limited and less than ideal reference samples. For instance, the individuals labeled SWE_Viking_Age_Sigtuna are supposed to be stand ins for Danish and Norwegian Vikings, but they're a relatively heterogeneous group from Sweden, possibly with some British or Irish ancestry, so they might be skewing the results.

However, I'll be adding many more ancient samples to the Global25 datasheets as they become available, including lots of new Vikings, which should greatly improve the accuracy of these sorts of fine-scale mixture models.

An exceedingly simple, yet feature-packed, online tool ideal for modeling ancestry with Global25 coordinates is the VahaduoJS. It's freely available HERE, and it also works offline after downloading the web page. Just copy paste the coordinates of your choice under the "source" and "target" tabs, and then mess around with the buttons to see what happens. The screen caps below show me doing just that.


However, it's important to note that the Global25 is a Principal Component Analysis (PCA), so it makes good sense to also use it for producing PCA graphs. To do this just plot any combination of two or three of its Principal Components (PCs) to create 2D or 3D graphs, respectively. This can be done with a wide variety of programs, including PAST, which is freely available here.

To produce a 2D graph, open a Global25 datasheet in PAST, choose comma as the separator, highlight any two columns of data, click on the "Plot" tab and, from the drop down list, pick "XY graph". Below is a series of graphs that I created in exactly this way. I also color coded the samples according to their geographic origins. This was done by ticking the "Row attributes" tab.


PAST can also be used to run PCA on subsets of the Global25 scaled data to produce remarkably accurate plots of fine-scale population structure. For instance, here's a plot based on present-day populations from north of the Alps, Balkans and Pyrenees.


To try this create a new text file with your choice of populations from the Global25 scaled datasheet, open it with PAST and choose Multivariate > Ordination > Principal Components Analysis. I've already put together several datasheets limited to European, Northern European, West Eurasian and South Asian populations. They're available at the links below along with more details on how to run them with PAST.

Global25 workshop 1: that classic West Eurasian plot

Global25 workshop 2: intra-European variation

Global25 workshop 3: genes vs geography in Northern Europe

The South Asian cline that no longer exists

Another free, easy to use online tool that works with Global25 coordinates is the Vahaduo Global25 Views [LINK]. Below is a screen cap of me checking out one of the many PCA that it offers.


And if you're fond of tree-like structures as a means to describe fine-scale genetic variation, please see this blog post...

Global25 workshop 4: a neighbour joining tree

See also...

New Global25 interpretation tools

Wednesday, February 27, 2019

The Steppe Maykop enigma


Who were the Steppe Maykop people exactly? Their ancestry must surely rank as one of the biggest surprises served up by ancient DNA to date.

I always thought that they'd turn out roughly like a mixture between populations associated with the Kura-Araxes and Yamnaya cultures (mostly because their territory was located sort of in between them). Nope, that wasn't even close. This is where they cluster compared to Kura-Araxes and Yamnaya samples in my Principal Component Analysis (PCA) of world-wide genetic variation: the Global25.
To explore the ancestry of the Steppe Maykop people in more detail I ran a couple of unsupervised Global25/nMonte tests, using basically every ancient population in the (scaled) Global25 datasheet that seemed chronologically sensible and even remotely relevant. I narrowed things down to these two mixture models.

Steppe_Maykop
Geoksiur_Eneolithic,11.2
Piedmont_Eneolithic,44.4
West_Siberia_N,44.4
distance%=1.5161

Steppe_Maykop
Piedmont_Eneolithic,46.6
Sarazm_Eneolithic,10.4
West_Siberia_N,43
distance%=1.6408

But, you might say, Global25/nMonte isn't a published analytical method and it doesn't run on formal statistics, the meat and potatoes of ancient DNA papers. OK then, let's try the same models with the qpAdm software, which is a published method and does run on formal statistics, using exactly the same samples.

Steppe_Maykop
Geoksiur_Eneolithic 0.100±0.032
Piedmont_Eneolithic 0.433±0.053
West_Siberia_N 0.467±0.028
chisq 19.155
tail prob 0.159096
Full output

Steppe_Maykop
Piedmont_Eneolithic 0.429±0.051
Sarazm_Eneolithic 0.119±0.033
West_Siberia_N 0.452±0.026
chisq 18.090
tail prob 0.202699
Full output

They're basically identical. Importantly, my models must reflect reality at some level, because otherwise I wouldn't be able to produce a pair of essentially identical results using such vastly different statistical methods. So the pertinent question is what do these results actually mean?

It seems unlikely to me that we're dealing here with a highly complex three-way mixture process, involving populations from such far flung locations as western Siberia and southern Central Asia. Rather, I suspect that Steppe Maykop was the result of a two-way mixture between Piedmont_Eneolithic (the population that lived before it on the steppe north of the Caucasus) and someone just a little bit more easterly. I'm guessing that the latter was the (as yet unsampled) population associated with the Kelteminar archeological culture.


By the way, please note that Piedmont_Eneolithic is made up of samples from two different locations on the Piedmont steppe, and I occasionally treat them as separate populations labeled Progress_Eneolithic and Vonyuchka_Eneolithic (for instance, see here).

Update 28/02/2019: Below is a PCA focusing on West Eurasian genetic variation. Overall, the position of Steppe Maykop relative to Geoksiur_Eneolithic, Piedmont_Eneolithic and West_Siberia_N appears to reflect my nMonte and qpAdm models. However, as per our discussion in the comments, one of the Steppe Maykop individuals (the most southerly one in the PCA) probably also has recent ancestry from the Caucasus.

See also...

An exceptional burial indeed, but not that of an Indo-European

Maykop: a multi-ethnic layer cake?

Late PIE ground zero now obvious; location of PIE homeland still uncertain, but...

Tuesday, November 20, 2018

Yamnaya: home-grown


I have some interesting news. It looks like Khvalynsk_Eneolithic I0434 can be used as essentially a perfect proxy for the Eneolithic steppe trio from Wang et al. 2018 when modeling the ancestry of the Yamnaya people of what is now the Samara region of Russia. Consider the qpAdm mixture models below, sorted by taildiff.

One of the best fitting models that also fairly closely matches archeological data, which suggest that Yamnaya was an amalgamation of the Khvalynsk, Repin and Sredny Stog cultures, is in bold. The worst fitting, and basically failed, models are listed below the dotted line. Note that almost all of these models feature reference populations from West and Central Asia.

Khvalynsk_I0434 + Iberia_ChL 0.681534184 > full output

Khvalynsk_I0434 + Globular_Amphora 0.525961242 > full output

Khvalynsk_I0434 + Iberia_Central_CA 0.515960444 > full output

Khvalynsk_I0434 + Sredny_Stog_I6561 0.485311962 > full output

Khvalynsk_I0434 + Varna 0.430411416 > full output

Khvalynsk_I0434 + Blatterhole_MN 0.328782809 > full output

Khvalynsk_I0434 + Baden_LCA 0.234307235 > full output

Khvalynsk_I0434 + Protoboleraz_LCA 0.231310724 > full output

Khvalynsk_I0434 + ALPc_MN 0.200002422 > full output

Khvalynsk_I0434 + Trypillia 0.193900977 > full output

Khvalynsk_I0434 + Balaton_Lasinja_CA 0.187031564 > full output

Khvalynsk_I0434 + Tiszapolgar_ECA 0.153940224 > full output

Khvalynsk_I0434 + Tisza_LN 0.145465993 > full output

Khvalynsk_I0434 + Balkans_ChL 0.111720163 > full output

...

Khvalynsk_I0434 + Armenia_EBA 0.0108890099 > full output

Khvalynsk_I0434 + Armenia_ChL 0.00882375703 > full output

Khvalynsk_I0434 + Levant_BA_North 0.0078751978 > full output

Khvalynsk_I0434 + Minoan_Lasithi 0.0675240088 > full output

Khvalynsk_I0434 + Peloponnese_N 0.046998906 > full output

Khvalynsk_I0434 + Hajji_Firuz_ChL 0.00269860335 > full output

Khvalynsk_I0434 + Shahr_I_Sokhta_BA1 0.00261908387 > full output

Khvalynsk_I0434 + Sarazm_Eneolithic 0.00120345503 > full output

Khvalynsk_I0434 + Seh_Gabi_ChL 0.00111898703 > full output

Khvalynsk_I0434 + Geoksiur_Eneolithic 0.000178295163 > full output

Khvalynsk_I0434 + Tepe_Hissar_ChL 0.000163698274 > full output

Khvalynsk_I0434 + Bustan_BA 0.000151088148 > full output

Why is this potentially important? Because unless Khvalynsk_Eneolithic I0434 was a recent migrant from the North Caucasus piedmont steppe, which is where the remains of the Eneolithic steppe trio were excavated, then Yamnaya's ethnogenesis might not have anything at all to do with Asia or even the Caucasus region. At least not within any reasonable time frame anyway. Here's a map showing the geographic locations of all of the populations relevant to the highlighted mixture model above.


I won't be fussed if it turns out that the majority of the ancestry of the Yamnaya, Corded Ware and other closely related ancient peoples was sourced from the Eneolithic populations of the North Caucasus piedmont steppe. But I think it's useful to make the point that there are still very few ancient samples available from the steppes between the Black and Caspian seas, so we don't yet have much of a clue how the groups living throughout this region during the Eneolithic and earlier fit into the grand scheme of things.

Update 24/12/2018: I decided to repeat the analysis, but this time with Caucasus Hunter-Gatherers (CHG) as one of the outgroups (or right pops). The reason I initially didn't include CHG in the outgroups was because I didn't want to discriminate, perhaps unfairly, against West and Central Asians with high levels of CHG-related ancestry, and in favor of Europeans with no or minimal CHG-related input. But in my opinion, the new results clearly make more sense, with Sredny Stog and Varna at the top of the list.

Khvalynsk_I0434 + Sredny_Stog_I6561 0.410719649 > full output

Khvalynsk_I0434 + Varna 0.394089365 > full output

Khvalynsk_I0434 + Iberia_ChL 0.16554258 > full output

Khvalynsk_I0434 + Globular_Amphora 0.128348823 > full output

Khvalynsk_I0434 + Iberia_Central_CA 0.126100242 > full output

Khvalynsk_I0434 + Trypillia 0.135306664 > full output

Khvalynsk_I0434 + Baden_LCA 0.0853031796 > full output

Khvalynsk_I0434 + Protoboleraz_LCA 0.0766892008 > full output

Khvalynsk_I0434 + Tisza_LN 0.0661622403 > full output

Khvalynsk_I0434 + Tiszapolgar_ECA 0.0626469042 > full output

Khvalynsk_I0434 + Balaton_Lasinja_CA 0.0536293042 > full output

Khvalynsk_I0434 + ALPc_MN 0.0505788809 > full output

...

Khvalynsk_I0434 + Minoan_Lasithi 0.0439451605 > full output

Khvalynsk_I0434 + Balkans_ChL 0.0436885241 > full output

Khvalynsk_I0434 + Blatterhole_MN 0.0329758292 > full output

Khvalynsk_I0434 + Peloponnese_N 0.0181930605 > full output

Khvalynsk_I0434 + Armenia_EBA 0.014715999 > full output

Khvalynsk_I0434 + Armenia_ChL 0.0060437014 > full output

Khvalynsk_I0434 + Levant_BA_North 0.00514574731 > full output

Khvalynsk_I0434 + Shahr_I_Sokhta_BA1 0.00350059625 > full output

Khvalynsk_I0434 + Hajji_Firuz_ChL 0.00228771991 > full output

Khvalynsk_I0434 + Seh_Gabi_ChL 0.00117061206 > full output

Khvalynsk_I0434 + Sarazm_Eneolithic 0.001118931 > full output

Khvalynsk_I0434 + Bustan_BA 0.00021203609 > full output

Khvalynsk_I0434 + Tepe_Hissar_ChL 0.000200643323 > full output

Khvalynsk_I0434 + Geoksiur_Eneolithic 0.000175941977 > full output

Update 17/02/2019: I basically managed to confirm my analysis with samples from the Wang et al. Caucasus paper. See here.

See also...

Big deal of 2018: Yamnaya not related to Maykop

"The Homeland: In the footprints of the early Indo-Europeans" time map

Late PIE ground zero now obvious; location of PIE homeland still uncertain, but...

Thursday, February 15, 2018

Modeling genetic ancestry with Davidski: step by step


There are many different ways to model your genetic ancestry but I prefer the Global25/nMonte method. This is a step by step guide to modeling ancient ancestry proportions with this simple but powerful method using my own genome.


As far as I know, the vast majority of my recent ancestors came from the northern half of Europe. This may or may not be correct, but it gives me somewhere to start, so that I can come up with a coherent model. If you don't have this sort of information, because, perhaps, you were adopted, then just look in the mirror, and work from there. Like I say, it's not imperative that you know anything whatsoever about your ancestry, because your genetic data will do the talking, but you do need a model when modeling.

In scientific literature nowadays Northern Europeans are often described as a three-way mixture between Yamnaya-related pastoralists, Anatolian-derived early farmers, and Western European Hunter-Gatherers (WHG). So let's see if this model works for me. Obviously, if it does, then it'll confirm the information that I have about my origins, but it might also reveal finer details that I'm not aware of. The datasheet that I'm using for this model is available here.

[1] distance%=6.9025 / distance=0.069025

Davidski

Yamnaya_Samara 53.9
Barcin_N 30.75
Rochedane 15.35
Tepecik_Ciftlik_N 0

Yep, the model does work, with a fairly reasonable distance of almost 7%. The ancestry proportions more or less match those from scientific literature and the plethora of analyses that I've featured at this blog on the topic. Please note that I've kept things very simple, using only four reference populations and individuals as proxies for four distinct streams of ancestry. But I've put my own twist on this Neolithic/Bronze Age model by including two populations from Neolithic Anatolia (Barcin_N and Tepecik_Ciftlik_N), just to see what would happen. The WHG proxy is Rochedane.

Admittedly, though, my Yamnaya cut of ancestry appears somewhat bloated at over 53%, and the model's distance is a little higher than what I normally see for really strong models. So let's check if I can get a better fitting and more sensible result by adding a slightly more easterly forager proxy than Rochedane: Narva_Lithuania.

[1] distance%=5.9331 / distance=0.059331

Davidski

Yamnaya_Samara 45.75
Barcin_N 31.45
Narva_Lithuania 22.8
Rochedane 0
Tepecik_Ciftlik_N 0

The statistical fit does improve, and when given a choice between Rochedane and Narva_Lithuania, the algorithm picks the latter as the only source of extra forager input in my genome.

What could this mean? It might mean that a large part of my ancestry derives from the Baltic region. Actually, I know for a fact that this is true. But even if I had no idea about my genealogy, this result would be a very strong hint about my genetic origins. Indeed, let's follow this trail and try to further improve the fit of the model by adding a more relevant Yamnaya-related proxy, such as early Baltic Corded Ware (CWC_Baltic_early).

[1] distance%=5.444 / distance=0.05444

Davidski

CWC_Baltic_early 54.95
Barcin_N 26.7
Narva_Lithuania 18.35
Rochedane 0
Tepecik_Ciftlik_N 0
Yamnaya_Samara 0

Holy shit! To be honest, I wasn't expecting this sort of resolution and accuracy, and I can't promise that everyone using the Global25/nMonte method will see such incredibly nuanced outcomes, but this isn't a fluke. It can't be, because it gels so well with everything that I know about my ancestry. Please note also that I belong to Y-chromosome haplogroup R1a-M417, which is a lineage intimately associated with the Corded Ware expansion across Northern Europe (for instance, see here).

But of course, the Baltic and nearby regions haven't been isolated from migrations and invasions since the Corded Ware times. For instance, at some point, probably during the Bronze Age, Uralic-speaking groups moved west across the forest zone of Northeastern Europe and into the East Baltic and northern Scandinavia. It's generally accepted that they brought Siberian admixture with them (see here). Moreover, from the Iron Age to the Middle Ages, East Central Europe was under intense pressure from a wide range of nomadic steppe groups with complex ancestry, such as the Sarmatians, Avars, Huns, and Mongolians. Did any of these peoples leave their mark on my genome? At the risk of overfitting the model, let's explore this possibility by adding a few more reference populations.

[1] distance%=5.444 / distance=0.05444

Davidski

CWC_Baltic_early 54.95
Barcin_N 26.7
Narva_Lithuania 18.35
Han 0
Mongolian 0
Nganassan 0
Rochedane 0
Sarmatian_Pokrovka 0
Tepecik_Ciftlik_N 0
Yamnaya_Samara 0

Nothing changes when I add the Han Chinese, Mongolians, Nganassans (a Uralic group from Siberia), and Sarmatians to the model. But what about if I throw in the only ancient Slav in my datasheet?

[1] distance%=2.9904 / distance=0.029904

Davidski

Slav_Bohemia 85.9
CWC_Baltic_early 7.7
Narva_Lithuania 6.4
Barcin_N 0
Rochedane 0
Tepecik_Ciftlik_N 0
Yamnaya_Samara 0

Considering that the vast majority of my recent ancestors were Poles, thus a Slavic-speaking people from near the Baltic, this outcome makes perfect sense. And check out the new distance! But the problem now is that I'm overfitting the model by using two very similar and probably very closely related references, CWC_Baltic_early and Slav_Bohemia. And overfitting should be avoided at all costs. So it might be useful to break up this effort into two models: one focusing on the Neolithic and Bronze Age, and the other on the Iron Age and Middle Ages. I'll do that soon, but not just yet, because there are still too few Iron Age and Medieval samples available from the Baltic region and surrounds for meaningful analyses of this type.

See also...

Genetic ancestry online store (to be updated regularly)