
Showing posts with label genetic ancestry. Show all posts
Showing posts with label genetic ancestry. Show all posts
Wednesday, February 5, 2025
G25 available again
To get your Global25 coords, please use the app HERE. The whole process usually takes a couple of days. Feel free to spread the word.
Please don't order the Global25 unless you have experience in modeling Global25 data with the Vahaduo analysis tools.
Note that the conversion of VCF, BAM, CRAM and/or fastq files is 30 to 50€ extra depending on the case. For enquiries please email teepean47 on g25requests@gmail.com.
Saturday, November 7, 2020
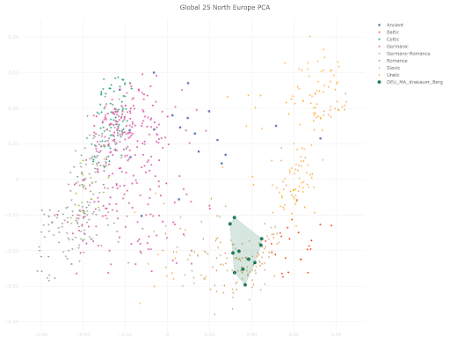
Slavic-like Medieval Germans
The samples labeled DEU_MA_Krakauer_Berg in the Principal Component Analysis (PCA) plot below are from a recent paper by Parker et al. at Scientific Reports. Their remains were excavated from a Medieval cemetery in the now abandoned village of Krakauer Berg in eastern Germany.
Krakauer sounds sort of like Kraków, doesn't it? That's probably not a coincidence, especially considering how these people behave in my analysis. To see an interactive version of the plot, paste the coordinates from the text file here into the relevant field here.
 See also...
Yamnaya-related ancestry proportions in present-day Poles
Warriors from at least two different populations fought in the Tollense Valley battle
Viking world open analysis and discussion thread
See also...
Yamnaya-related ancestry proportions in present-day Poles
Warriors from at least two different populations fought in the Tollense Valley battle
Viking world open analysis and discussion thread
Friday, August 7, 2020
New Global25 interpretation tools
They're available at Ancestry Calculator and GENOPLOT. Unfortunately, I can't tell you exactly how to get the most out of them. All I can recommend is robust experimentation.
 See also...
Getting the most out of the Global25
Genetic ancestry online store
Modeling your ancestry has never been easier
See also...
Getting the most out of the Global25
Genetic ancestry online store
Modeling your ancestry has never been easier
Monday, July 13, 2020
Don't believe everything you read in peer reviewed papers
Case in point, here's a quote from a recent paper at the Journal of Human Genetics (emphasis is mine):
 That's not to say, of course, that some Germans don't have recent Turkish ancestry, because an increasing number of Germans nowadays do, nor that people with German heritage in Russia shouldn't identify as Germans, because that's entirely their choice.
This blog post isn't about what it takes to be German, and this is not something that I ever want to discuss for obvious reasons. The point I'm making here is that the authors and peer reviewers of the said paper at the Journal of Human Genetics were sloppy and half-arsed in their approach. And, sadly, this isn't an isolated case in peer reviewed scientific literature dealing with human population genetics.
I feel that the Estonian Biocentre is also partly to blame for this cock up, due to its somewhat peculiar sampling and labelling strategies. For instance, its scientists rely solely on self-reported identity to establish the ethnic origins of their samples, and they apparently never remove genetic outliers from their datasets or even try to identify them.
Unfortunately, I fear that this relaxed approach will eventually lead to basic errors and even unusual conclusions in a number of so called peer reviewed papers.
I first raised this issue with the Estonian Biocentre about five years ago, when I noticed that some of the supposedly Polish individuals in its dataset were genetically more similar to various groups from northern Russia than to Poles from Poland. These individuals also showed significant Siberian ancestry, which was very unusual indeed. Where the hell did the Estonian Biocentre find Poles who resembled people from near the Arctic Circle, you might ask? Apparently in Estonia.
OK, I can imagine that sampling ethnic Poles from Estonia may have been easier for the Estonian Biocentre than sampling Poles from Poland. And Estonian Poles certainly make for interesting and useful data points. However, as you can see in the PCA below, some of these individuals (labeled Polish_Estonia by me) aren't representative of the native Polish population, and yet the Estonian Biocentre not only lumps them with their Poles from Poland, but even labels them with the word "Poland". The relevant PCA datasheet can be gotten here.
That's not to say, of course, that some Germans don't have recent Turkish ancestry, because an increasing number of Germans nowadays do, nor that people with German heritage in Russia shouldn't identify as Germans, because that's entirely their choice.
This blog post isn't about what it takes to be German, and this is not something that I ever want to discuss for obvious reasons. The point I'm making here is that the authors and peer reviewers of the said paper at the Journal of Human Genetics were sloppy and half-arsed in their approach. And, sadly, this isn't an isolated case in peer reviewed scientific literature dealing with human population genetics.
I feel that the Estonian Biocentre is also partly to blame for this cock up, due to its somewhat peculiar sampling and labelling strategies. For instance, its scientists rely solely on self-reported identity to establish the ethnic origins of their samples, and they apparently never remove genetic outliers from their datasets or even try to identify them.
Unfortunately, I fear that this relaxed approach will eventually lead to basic errors and even unusual conclusions in a number of so called peer reviewed papers.
I first raised this issue with the Estonian Biocentre about five years ago, when I noticed that some of the supposedly Polish individuals in its dataset were genetically more similar to various groups from northern Russia than to Poles from Poland. These individuals also showed significant Siberian ancestry, which was very unusual indeed. Where the hell did the Estonian Biocentre find Poles who resembled people from near the Arctic Circle, you might ask? Apparently in Estonia.
OK, I can imagine that sampling ethnic Poles from Estonia may have been easier for the Estonian Biocentre than sampling Poles from Poland. And Estonian Poles certainly make for interesting and useful data points. However, as you can see in the PCA below, some of these individuals (labeled Polish_Estonia by me) aren't representative of the native Polish population, and yet the Estonian Biocentre not only lumps them with their Poles from Poland, but even labels them with the word "Poland". The relevant PCA datasheet can be gotten here.
 However, based on my communications with some of the scientists at the Estonian Biocentre, including head honcho Mait Mestpalu, it seems that nothing will ever change there in regards to this issue. Who knows, perhaps some day we'll see a paper based on Estonian Biocentre data in the Journal of Human Genetics claiming that Poles originated near the Arctic Circle? I wouldn't be shocked if that actually happened.
Citation...
Ádám, V., Bánfai, Z., Maász, A. et al. Investigating the genetic characteristics of the Csangos, a traditionally Hungarian speaking ethnic group residing in Romania. J Hum Genet (2020). https://doi.org/10.1038/s10038-020-0799-6
See also...
Like three peas in a pod
However, based on my communications with some of the scientists at the Estonian Biocentre, including head honcho Mait Mestpalu, it seems that nothing will ever change there in regards to this issue. Who knows, perhaps some day we'll see a paper based on Estonian Biocentre data in the Journal of Human Genetics claiming that Poles originated near the Arctic Circle? I wouldn't be shocked if that actually happened.
Citation...
Ádám, V., Bánfai, Z., Maász, A. et al. Investigating the genetic characteristics of the Csangos, a traditionally Hungarian speaking ethnic group residing in Romania. J Hum Genet (2020). https://doi.org/10.1038/s10038-020-0799-6
See also...
Like three peas in a pod
The Mordovian and Csango samples have a moderate to slight orientation toward the Central-Asian and Siberian Turkic groups. This could suggest the more significant East Eurasian or Turkic ancestry of these populations, which should be further investigated. German samples are inhomogeneous, and some of the German samples also show this tendency, which can be the result of the recent 20th century Turkish immigration into Germany [42].Nope, these German samples don't show anything even remotely resembling recent Turkish ancestry. The authors of the paper, Ádám, V., Bánfai, Z., Maász, A. et al., should've been able to figure this out, even with the standard analyses that they ran. Failing that, the peer reviewers at the Journal of Human Genetics should've noticed that the authors were confused. Moreover, if the authors and peer reviewers actually bothered to take a closer look at metadata for these samples, which were sourced from the Estonian Biocentre, they'd see that they're not even from Germany. In fact, they represent self-reported ethnic Germans from Russia. My own quick and dirty analysis of these individuals suggests that many of them harbor East Slavic and/or Volga Finnic ancestries. Indeed, only some of them can pass genetically for run of the mill Germans from Germany. The Principal Component Analysis (PCA) below is self-explanatory. It was plotted with the Vahaduo Custom PCA tools freely available here. The relevant PCA datasheet can be gotten here.


Tuesday, November 5, 2019
Modeling your ancestry has never been easier
An exceedingly simple, yet feature-packed, online tool ideal for modeling ancestry with Global25 coordinates is freely available HERE. It works offline too, after downloading the web page onto your computer. Just copy paste the coordinates of your choice under the "source" and "target" tabs, and then mess around with the buttons to see what happens. The screen caps below show me doing just that.


 Another free, easy to use online tool that works with Global25 coordinates is the Principal Component Analysis (PCA) runner HERE. Below is a screen cap of me checking out one of the many PCA that it offers.
 See also...
Getting the most out of the Global25
See also...
Getting the most out of the Global25


Friday, July 12, 2019
Getting the most out of the Global25
The first thing you need to know about the Global25 is that I update the relevant datasheets regularly, usually every few weeks, but they're always at these links:
 To start the mixture modeling process, type or copy paste getMonte('data.txt', 'target.txt') into the R console window, hit "enter", and wait for the results. After a short time, probably less than a minute or two, you should see this output.
 The data and target files contain population averages. And, as you can see, the results that these population averages have produced are in line with what one would expect from such a model focusing on the genetic shifts in Northern Europe during the Late Neolithic. Very similar ancient ancestry proportions have been reported for the English and other Northern Europeans recently in scientific literature.
However, when focusing on exceptionally fine-scale genetic variation that isn't reflected too well in the Global25 population averages, a more effective strategy might be to use multiple individuals from each reference population and let nMonte3 aggregate and average the inferred ancestry proportions.
This is often the case when attempting to model ancestry proportions for more recent periods, such as the Middle Ages. So let's try this with the English sample set using a modified data file, which is available here.
Replace the old data file with the new one in your working directory, and, like before, copy paste into the R console window the following two commands, hitting "enter" after each one: source('nMonte3.R') and getMonte('data.txt', 'target.txt'). This is what you should eventually see.
The data and target files contain population averages. And, as you can see, the results that these population averages have produced are in line with what one would expect from such a model focusing on the genetic shifts in Northern Europe during the Late Neolithic. Very similar ancient ancestry proportions have been reported for the English and other Northern Europeans recently in scientific literature.
However, when focusing on exceptionally fine-scale genetic variation that isn't reflected too well in the Global25 population averages, a more effective strategy might be to use multiple individuals from each reference population and let nMonte3 aggregate and average the inferred ancestry proportions.
This is often the case when attempting to model ancestry proportions for more recent periods, such as the Middle Ages. So let's try this with the English sample set using a modified data file, which is available here.
Replace the old data file with the new one in your working directory, and, like before, copy paste into the R console window the following two commands, hitting "enter" after each one: source('nMonte3.R') and getMonte('data.txt', 'target.txt'). This is what you should eventually see.
 It's difficult to say how accurate these estimates are. But they look more or less correct considering the limited and less than ideal reference samples. For instance, the individuals labeled SWE_Viking_Age_Sigtuna are supposed to be stand ins for Danish and Norwegian Vikings, but they're a relatively heterogeneous group from Sweden, possibly with some British or Irish ancestry, so they might be skewing the results.
However, I'll be adding many more ancient samples to the Global25 datasheets as they become available, including lots of new Vikings, which should greatly improve the accuracy of these sorts of fine-scale mixture models.
An exceedingly simple, yet feature-packed, online tool ideal for modeling ancestry with Global25 coordinates is the VahaduoJS. It's freely available HERE, and it also works offline after downloading the web page. Just copy paste the coordinates of your choice under the "source" and "target" tabs, and then mess around with the buttons to see what happens. The screen caps below show me doing just that.
However, it's important to note that the Global25 is a Principal Component Analysis (PCA), so it makes good sense to also use it for producing PCA graphs. To do this just plot any combination of two or three of its Principal Components (PCs) to create 2D or 3D graphs, respectively. This can be done with a wide variety of programs, including PAST, which is freely available here.
To produce a 2D graph, open a Global25 datasheet in PAST, choose comma as the separator, highlight any two columns of data, click on the "Plot" tab and, from the drop down list, pick "XY graph". Below is a series of graphs that I created in exactly this way. I also color coded the samples according to their geographic origins. This was done by ticking the "Row attributes" tab.
It's difficult to say how accurate these estimates are. But they look more or less correct considering the limited and less than ideal reference samples. For instance, the individuals labeled SWE_Viking_Age_Sigtuna are supposed to be stand ins for Danish and Norwegian Vikings, but they're a relatively heterogeneous group from Sweden, possibly with some British or Irish ancestry, so they might be skewing the results.
However, I'll be adding many more ancient samples to the Global25 datasheets as they become available, including lots of new Vikings, which should greatly improve the accuracy of these sorts of fine-scale mixture models.
An exceedingly simple, yet feature-packed, online tool ideal for modeling ancestry with Global25 coordinates is the VahaduoJS. It's freely available HERE, and it also works offline after downloading the web page. Just copy paste the coordinates of your choice under the "source" and "target" tabs, and then mess around with the buttons to see what happens. The screen caps below show me doing just that.
However, it's important to note that the Global25 is a Principal Component Analysis (PCA), so it makes good sense to also use it for producing PCA graphs. To do this just plot any combination of two or three of its Principal Components (PCs) to create 2D or 3D graphs, respectively. This can be done with a wide variety of programs, including PAST, which is freely available here.
To produce a 2D graph, open a Global25 datasheet in PAST, choose comma as the separator, highlight any two columns of data, click on the "Plot" tab and, from the drop down list, pick "XY graph". Below is a series of graphs that I created in exactly this way. I also color coded the samples according to their geographic origins. This was done by ticking the "Row attributes" tab.
 PAST can also be used to run PCA on subsets of the Global25 scaled data to produce remarkably accurate plots of fine-scale population structure. For instance, here's a plot based on present-day populations from north of the Alps, Balkans and Pyrenees.
 To try this create a new text file with your choice of populations from the Global25 scaled datasheet, open it with PAST and choose Multivariate > Ordination > Principal Components Analysis. I've already put together several datasheets limited to European, Northern European, West Eurasian and South Asian populations. They're available at the links below along with more details on how to run them with PAST.
And if you're fond of tree-like structures as a means to describe fine-scale genetic variation, please see this blog post...
To try this create a new text file with your choice of populations from the Global25 scaled datasheet, open it with PAST and choose Multivariate > Ordination > Principal Components Analysis. I've already put together several datasheets limited to European, Northern European, West Eurasian and South Asian populations. They're available at the links below along with more details on how to run them with PAST.
And if you're fond of tree-like structures as a means to describe fine-scale genetic variation, please see this blog post...
Global25 datasheet ancient scaled Global25 pop averages ancient scaled Global25 datasheet ancient Global25 pop averages ancient ... Global25 datasheet modern scaled Global25 pop averages modern scaled Global25 datasheet modern Global25 pop averages modernGlobal25 data for samples from a variety of papers that have been published recently will eventually be incorporated into the main datasheets linked above, but the process might take several weeks or even months. In the meantime, feel free to use the temporary datasheets below. Thanks for your patience.
Allentoft 2023 Chylenski 2023 Jeong 2024 Koptekin 2022 Olalde 2023 Peltola 2022 Penske 2023 Posth 2023 Sirak 2024 Skourtanioti 2023 Stolarek 2023 Varela 2023 Wang 2023 Yu 2023Each sample has a population code and an individual code. The population codes represent the countries, ethnic groups and/or archeological affinities of the samples, and I often modify these codes to suit my needs. On the other hand, the individual codes are unique to most of the samples and I usually don't change them. So if you'd like to know more details about the samples try searching for their individual codes via a decent online search engine. Basic information about many of the samples is also available in the "anno" files here. The main purpose of the Global25 is to provide data for mixture modeling. In other words, for estimating ancestry proportions, both ancient and modern (see here). This can be done on your computer with the R program and the nMonte R script, or online with a couple of different tools, which I discuss below. If you don't have R installed on your computer, you can get it here, while nMonte is available here. For this tutorial please download nMonte and nMonte3, and store them in your main working folder (usually My Documents). Once you have R set up, make sure its working directory is the same place where you stored nMonte. You can check this in R by clicking on "File" and then "Change dir". Additionally, you'll need two nMonte input files in the working directory titled "data" and "target". Examples of these files are available here. We'll be using them to test the ancient ancestry proportions of a sample set from present-day England. Before you can begin the analysis you need to first call the nMonte script by typing or copy pasting source('nMonte.R') into the R console window, and then hitting "enter" on your keyboard. This is what you should see in the R console window afterwards.


Global25 workshop 1: that classic West Eurasian plot Global25 workshop 2: intra-European variation Global25 workshop 3: genes vs geography in Northern Europe The South Asian cline that no longer existsAnother free, easy to use online tool that works with Global25 coordinates is the Vahaduo Global25 Views [LINK]. Below is a screen cap of me checking out one of the many PCA that it offers.
Global25 workshop 4: a neighbour joining treeSee also... New Global25 interpretation tools
Wednesday, July 3, 2019
Evidence of European ancestry in the Philistines
The abstract below has just appeared at the European Nucleotide Archive (see here), so I'm guessing that the relevant paper and accompanying ancient genome-wide data will be published within weeks if not days. Emphasis is mine:
 See also...
Five foot Philistines
How did steppe ancestry spread into the Biblical-era Levant?
See also...
Five foot Philistines
How did steppe ancestry spread into the Biblical-era Levant?
The ancient Mediterranean port-city of Ashkelon, identified as “Philistine” during the Iron Age, underwent a dramatic cultural change between the Late Bronze- and the early Iron- Age. It has been long debated whether this change was driven by a substantial movement of people, possibly linked to a larger migration of the so-called “Sea Peoples”. Here, we report genome-wide data of ten Bronze- and Iron- Age individuals from Ashkelon. We find that the early Iron Age population was genetically distinct due to a European related admixture. Interestingly, this genetic signal is no longer detectible in the later Iron Age population. Our results support that a migration event occurred during the Bronze- to Iron- Age transition in Ashkelon but did not leave a long-lasting genetic signature.Update 4/7/2019: The paper is now available at Science Advances [LINK]. One of the Ashkelon ancients, who also shows a relatively high level of European ancestry, belongs to Y-Chromosome haplogroup R1 (probably R1b-M269). I've updated my Global25 datasheets with the new samples. Look for the Levant_ISR_Ashkelon prefix. Same links as always...
Global25 datasheet ancient scaled Global25 pop averages ancient scaled Global25 datasheet ancient Global25 pop averages ancientThis is how they cluster in my Principal Component Analysis (PCA) of ancient West Eurasian genetic variation. The relevant datasheet is available here. Based on these results, it's tempting to think that the European ancestry in the Philistines may have been of Greek provenance. But keep in mind that this is just a two dimensional view and a simplification of reality. I'll have more to say about the ancestry of these individuals and the origins of the Philistines in future blog posts.

Friday, April 12, 2019
Armenians vs Georgians
Armenians and Georgians are ethnic groups that live side by side in the south Caucasus, or Transcaucasia. By all accounts, they've both been there since prehistoric times and they're very similar in terms of overall genetic structure.
However, they speak languages from totally unrelated families: Indo-European and Kartvelian, respectively. How did this happen and might the answer lie in the small genetic differences that do exist between them?
To investigate this issue, I ran a series of qpAdm formal mixture models of present-day Armenians and Georgians using tens of ancient reference populations. To come up with as straightforward and meaningful results as possible, I constrained myself to two-way models. I then discarded the runs that produced "tail probs" under 0.1 and retained less than 400K SNPs. Only a handful of models passed muster, including these two:
Armenian Mycenaeans_&_Empuries2 0.233±0.041 Kura-Araxes_Kaps 0.767±0.041 chisq 18.422 tail prob 0.142151 Full output Georgian Globular_Amphora 0.071±0.025 Kura-Araxes_Kaps 0.929±0.025 chisq 18.419 tail prob 0.142266 Full outputAt the most basic level, the results suggest that both Armenians and Georgians are overwhelmingly derived from populations of Bronze Age Transcaucasia associated with the Kura-Araxes archeological culture, albeit with minor ancestries from somewhat different sources from the west. As far as I can see, when using more than 400K SNPs and a wide range and large number of outgroups (or right pops), neither Armenians nor Georgians can pass perfectly for any one ancient population in my dataset. The best proxies for the minor but significant western ancestry in Armenians are Mycenaeans of the Bronze Age Aegean region and Greek colonists from Iron Age Iberia (Empuries2). Obviously, and perhaps importantly, these are both attested Indo-European-speaking groups. On the other hand, the very minor western ancestry in Georgians is best characterized as gene flow from Middle to Late Neolithic European farmers rich in indigenous European forager ancestry. It's practically impossible to say what language or languages these farmers spoke. How about something Kartvelian? In any case, for me, the perplexing thing about present-day Armenians is that they harbor very little steppe ancestry. By and large, no more than a few per cent. Compare that to the currently available samples from what is now Armenia dating to the Middle to Late Bronze Age, which show ratios of steppe ancestry of up to 25%. For now, I'm guessing that what we're dealing with here is the classic bounce back of older ancestry layers that has been documented for different parts and periods of prehistoric Europe. See also... Early chariot drivers of Transcaucasia came from... Catacomb > Armenia_MLBA Late PIE ground zero now obvious; location of PIE homeland still uncertain, but...
Thursday, February 15, 2018
Modeling genetic ancestry with Davidski: step by step
There are many different ways to model your genetic ancestry but I prefer the Global25/nMonte method. This is a step by step guide to modeling ancient ancestry proportions with this simple but powerful method using my own genome.
 As far as I know, the vast majority of my recent ancestors came from the northern half of Europe. This may or may not be correct, but it gives me somewhere to start, so that I can come up with a coherent model. If you don't have this sort of information, because, perhaps, you were adopted, then just look in the mirror, and work from there. Like I say, it's not imperative that you know anything whatsoever about your ancestry, because your genetic data will do the talking, but you do need a model when modeling.
In scientific literature nowadays Northern Europeans are often described as a three-way mixture between Yamnaya-related pastoralists, Anatolian-derived early farmers, and Western European Hunter-Gatherers (WHG). So let's see if this model works for me. Obviously, if it does, then it'll confirm the information that I have about my origins, but it might also reveal finer details that I'm not aware of. The datasheet that I'm using for this model is available here.
As far as I know, the vast majority of my recent ancestors came from the northern half of Europe. This may or may not be correct, but it gives me somewhere to start, so that I can come up with a coherent model. If you don't have this sort of information, because, perhaps, you were adopted, then just look in the mirror, and work from there. Like I say, it's not imperative that you know anything whatsoever about your ancestry, because your genetic data will do the talking, but you do need a model when modeling.
In scientific literature nowadays Northern Europeans are often described as a three-way mixture between Yamnaya-related pastoralists, Anatolian-derived early farmers, and Western European Hunter-Gatherers (WHG). So let's see if this model works for me. Obviously, if it does, then it'll confirm the information that I have about my origins, but it might also reveal finer details that I'm not aware of. The datasheet that I'm using for this model is available here.
[1] distance%=6.9025 / distance=0.069025 Davidski Yamnaya_Samara 53.9 Barcin_N 30.75 Rochedane 15.35 Tepecik_Ciftlik_N 0Yep, the model does work, with a fairly reasonable distance of almost 7%. The ancestry proportions more or less match those from scientific literature and the plethora of analyses that I've featured at this blog on the topic. Please note that I've kept things very simple, using only four reference populations and individuals as proxies for four distinct streams of ancestry. But I've put my own twist on this Neolithic/Bronze Age model by including two populations from Neolithic Anatolia (Barcin_N and Tepecik_Ciftlik_N), just to see what would happen. The WHG proxy is Rochedane. Admittedly, though, my Yamnaya cut of ancestry appears somewhat bloated at over 53%, and the model's distance is a little higher than what I normally see for really strong models. So let's check if I can get a better fitting and more sensible result by adding a slightly more easterly forager proxy than Rochedane: Narva_Lithuania.
[1] distance%=5.9331 / distance=0.059331 Davidski Yamnaya_Samara 45.75 Barcin_N 31.45 Narva_Lithuania 22.8 Rochedane 0 Tepecik_Ciftlik_N 0The statistical fit does improve, and when given a choice between Rochedane and Narva_Lithuania, the algorithm picks the latter as the only source of extra forager input in my genome. What could this mean? It might mean that a large part of my ancestry derives from the Baltic region. Actually, I know for a fact that this is true. But even if I had no idea about my genealogy, this result would be a very strong hint about my genetic origins. Indeed, let's follow this trail and try to further improve the fit of the model by adding a more relevant Yamnaya-related proxy, such as early Baltic Corded Ware (CWC_Baltic_early).
[1] distance%=5.444 / distance=0.05444 Davidski CWC_Baltic_early 54.95 Barcin_N 26.7 Narva_Lithuania 18.35 Rochedane 0 Tepecik_Ciftlik_N 0 Yamnaya_Samara 0Holy shit! To be honest, I wasn't expecting this sort of resolution and accuracy, and I can't promise that everyone using the Global25/nMonte method will see such incredibly nuanced outcomes, but this isn't a fluke. It can't be, because it gels so well with everything that I know about my ancestry. Please note also that I belong to Y-chromosome haplogroup R1a-M417, which is a lineage intimately associated with the Corded Ware expansion across Northern Europe (for instance, see here). But of course, the Baltic and nearby regions haven't been isolated from migrations and invasions since the Corded Ware times. For instance, at some point, probably during the Bronze Age, Uralic-speaking groups moved west across the forest zone of Northeastern Europe and into the East Baltic and northern Scandinavia. It's generally accepted that they brought Siberian admixture with them (see here). Moreover, from the Iron Age to the Middle Ages, East Central Europe was under intense pressure from a wide range of nomadic steppe groups with complex ancestry, such as the Sarmatians, Avars, Huns, and Mongolians. Did any of these peoples leave their mark on my genome? At the risk of overfitting the model, let's explore this possibility by adding a few more reference populations.
[1] distance%=5.444 / distance=0.05444 Davidski CWC_Baltic_early 54.95 Barcin_N 26.7 Narva_Lithuania 18.35 Han 0 Mongolian 0 Nganassan 0 Rochedane 0 Sarmatian_Pokrovka 0 Tepecik_Ciftlik_N 0 Yamnaya_Samara 0Nothing changes when I add the Han Chinese, Mongolians, Nganassans (a Uralic group from Siberia), and Sarmatians to the model. But what about if I throw in the only ancient Slav in my datasheet?
[1] distance%=2.9904 / distance=0.029904 Davidski Slav_Bohemia 85.9 CWC_Baltic_early 7.7 Narva_Lithuania 6.4 Barcin_N 0 Rochedane 0 Tepecik_Ciftlik_N 0 Yamnaya_Samara 0Considering that the vast majority of my recent ancestors were Poles, thus a Slavic-speaking people from near the Baltic, this outcome makes perfect sense. And check out the new distance! But the problem now is that I'm overfitting the model by using two very similar and probably very closely related references, CWC_Baltic_early and Slav_Bohemia. And overfitting should be avoided at all costs. So it might be useful to break up this effort into two models: one focusing on the Neolithic and Bronze Age, and the other on the Iron Age and Middle Ages. I'll do that soon, but not just yet, because there are still too few Iron Age and Medieval samples available from the Baltic region and surrounds for meaningful analyses of this type. See also... Genetic ancestry online store (to be updated regularly)
Tuesday, October 31, 2017
Genetic ancestry online store
Update 05/02/2025: To get your Global25 coords, please use the app HERE. The whole process usually takes a couple of days. Feel free to spread the word.
Please don't order the Global25 unless you have experience in modeling Global25 data with the Vahaduo analysis tools.
Note that the conversion of VCF, BAM, CRAM and/or fastq files is 30 to 50€ extra depending on the case. For enquiries please email teepean47 on g25requests@gmail.com.
...
Following a rigorous testing phase, the awesome Global 25 analysis is now available at the store for $12 USD. What's so awesome about this test, you might ask? See here and here.
Please send your request and autosomal genotype data (from AncestryDNA, FTDNA, LivingDNA, MyHeritage or 23andMe) to eurogenesblog at gmail dot com.
However, note that this test is free for anyone who already has Global 10 coordinates (see here). That's right, if you already have Global 10 coordinates, all you have to do is to send me your data and say what it's for. Simple as that.
...
My Celtic vs Germanic Principal Component Analysis (PCA) is now available via the store for $6 USD (see here). Please note that this test is only really useful for people of Central, Northern and/or Western European origin, and indeed geared for those of overwhelmingly Northwestern European ancestry.
 Please send your request and autosomal genotype data (from AncestryDNA, FTDNA, LivingDNA, MyHeritage or 23andMe) to eurogenesblog at gmail dot com.
...
The popular Basal-rich K7 admixture test is now available via the store for $6 USD. It's suitable for everyone, except people with significant (>10%) Sub-Saharan ancestry. For more information about this test and some ideas about what to do with the output see here and here.
Please send your request and autosomal genotype data (from AncestryDNA, FTDNA, LivingDNA, MyHeritage or 23andMe) to eurogenesblog at gmail dot com.
...
The popular Basal-rich K7 admixture test is now available via the store for $6 USD. It's suitable for everyone, except people with significant (>10%) Sub-Saharan ancestry. For more information about this test and some ideas about what to do with the output see here and here.
 Please send your request and autosomal genotype data (from AncestryDNA, FTDNA, LivingDNA, MyHeritage or 23andMe) to eurogenesblog at gmail dot com.
See also...
Global25 workshop 1: that classic West Eurasian plot
Global25 workshop 2: intra-European variation
Global25 workshop 3: genes vs geography in Northern Europe
Getting the most out of the Global25
Modeling genetic ancestry with Davidski: step by step
Please send your request and autosomal genotype data (from AncestryDNA, FTDNA, LivingDNA, MyHeritage or 23andMe) to eurogenesblog at gmail dot com.
See also...
Global25 workshop 1: that classic West Eurasian plot
Global25 workshop 2: intra-European variation
Global25 workshop 3: genes vs geography in Northern Europe
Getting the most out of the Global25
Modeling genetic ancestry with Davidski: step by step


Subscribe to:
Posts (Atom)