
Showing posts with label PCA. Show all posts
Showing posts with label PCA. Show all posts
Wednesday, February 5, 2025
G25 available again
To get your Global25 coords, please use the app HERE. The whole process usually takes a couple of days. Feel free to spread the word.
Please don't order the Global25 unless you have experience in modeling Global25 data with the Vahaduo analysis tools.
Note that the conversion of VCF, BAM, CRAM and/or fastq files is 30 to 50€ extra depending on the case. For enquiries please email teepean47 on g25requests@gmail.com.
Monday, January 6, 2025
Leo Speidel & Pontus Skoglund
This quote, from a new paper at Nature, High-resolution genomic history of early medieval Europe by Speidel et al., is the most idiotic take on the ancestry of present-day Hungarians that I've ever read.
 If Speidel et al. were correct about the genetic origin of present-day Hungarians, then the Hungarian_Modern and Hungary_Scythian samples would be shifted away from other Europeans, much like many of the Hungary_Avar and Hungary_Conqueror individuals. But that's obviously not the case, and instead they cluster strongly with, say, present-day Germans from Hamburg.
I emailed two of the authors of this paper, Leo Speidel and Pontus Skoglund, when they posted the preprint of the paper at bioRxiv to cordially discuss this issue (see here). But they totally ignored me.
Citation...
Speidel et al., High-resolution genomic history of early medieval Europe, Published online: 1 January 2025, https://doi.org/10.1038/s41586-024-08275-2
If Speidel et al. were correct about the genetic origin of present-day Hungarians, then the Hungarian_Modern and Hungary_Scythian samples would be shifted away from other Europeans, much like many of the Hungary_Avar and Hungary_Conqueror individuals. But that's obviously not the case, and instead they cluster strongly with, say, present-day Germans from Hamburg.
I emailed two of the authors of this paper, Leo Speidel and Pontus Skoglund, when they posted the preprint of the paper at bioRxiv to cordially discuss this issue (see here). But they totally ignored me.
Citation...
Speidel et al., High-resolution genomic history of early medieval Europe, Published online: 1 January 2025, https://doi.org/10.1038/s41586-024-08275-2
Present-day populations of Hungary do not appear to derive detectable ancestry from early medieval individuals from Longobard contexts, and are instead more similar to Scythian-related ancestry sources (Extended Data Fig. 6), consistent with the later impact of Avars, Magyars and other eastern groups.In fact, present-day Hungarians are overwhelmingly derived from West Slavic and German peasants, showing only minor ancestry from early Magyars (or rather Hungarian Conquerors). So in terms of genetic ancestry they're basically typical East Central Europeans. Scythians and Avars don't even deserve a mention in this context. The reason that Speidel et al. found present-day Hungarians to be broadly similar to Scythians is because they used so called Hungarian Scythians in their analysis. It's important to understand that these Hungarian Scythians are genetically fairly typical Central Europeans for their time, and, by and large, don't show any significant genetic relationship to Asian Scythians, Avars or early Magyars. So they're mostly either just acculturated Scythians or wrongly classified as Scythians by archeologists. That is, the broad similarity that Speidel et al. found between present-day Hungarians and Hungarian Scythians derives from the fact that both of these populations are genetically Central Europeans, rather than the ridiculously false idea that they show strong genetic links to Avars, Hungarian Conquerors and other eastern groups. Here's a Principal Component Analysis (PCA) of West Eurasian genetic variation, courtesy of the excellent Vahaduo:Global25 Views, that perfectly illustrates my point.

Friday, November 10, 2023
Wielbark Goths were overwhelmingly of Scandinavian origin
When used properly, Principal Component Analysis (PCA) is an extraordinarily powerful tool and one of the best ways to study fine-scale genetic substructures within Europe.
The PCA plot below is based on Global25 data and focuses on the genetic relationship between Wielbark Goths and Medieval Poles, including from the Viking Age, in the context of present-day European genetic variation.
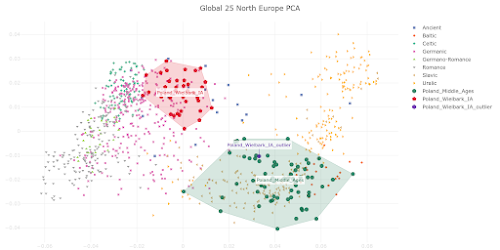 I'd say that it's a wonderfully self-explanatory plot, but here are some key observations:
 Polish groups from the Middle Ages are marked with the MA suffix, while the Iron Age Wielbark Goths are marked with the IA suffix.
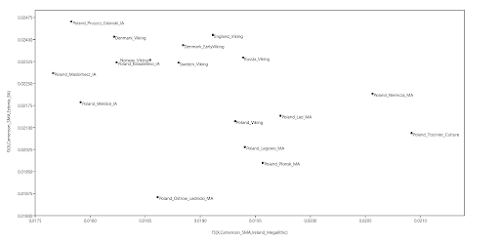
If you're wondering why I plotted the f3-statistics that I did, take a look at this (all groups largely of Scandinavian origin are emboldened):
Polish groups from the Middle Ages are marked with the MA suffix, while the Iron Age Wielbark Goths are marked with the IA suffix.
If you're wondering why I plotted the f3-statistics that I did, take a look at this (all groups largely of Scandinavian origin are emboldened):

- the Wielbark Goths (Poland_Wielbark_IA) and Medieval Poles (Poland_Middle_Ages) are two distinct populations - moreover, the Wielbark Goths form a relatively compact Scandinavian-related cluster and must surely represent a homogenous population overwhelmingly of Scandinavian origin - on the other hand, the Medieval Poles form a more extensive and heterogeneous cluster that overlaps with present-day groups all the way from Central Europe to the East Baltic, and that's because they are likely to be in large part of mixed origin - I know for a fact that at least some of these early Poles harbor recent admixture, because their burials are similar to those of Vikings and their haplotypes have been shown to be partly of Scandinavian origin (see here) - one of the Wielbark females is an obvious genetic outlier (Poland_Wielbark_IA_outlier), and basically looks like a first generation mixture between a Goth and a Balt.Please note that the PCA is only based on relatively high quality genomes, so as not to confuse the picture with spurious results and noise. Also, all outliers with potentially significant ancestry from outside of Central, Eastern and Northern Europe were removed from the analysis. The relevant datasheet is available here. However, sanity checks are always important when studying complex topics like fine-scale genetic ancestry. To that end I've prepared a graph based on f3-statistics of the form f3(X,Cameroon_SMA,Estonia_BA)/(X,Cameroon_SMA,Ireland_Megalithic), that reproduces the key features of my PCA. The relevant datasheet is available here.

f3(X,Estonia_BA,Cameroon_SMA) Poland_Legowo_MA 0.226406 Poland_Ostrow_Lednicki_MA 0.225996 Poland_Plonsk_MA 0.225017 Poland_Trzciniec_Culture 0.224215 Poland_Lad_MA 0.224142 Poland_Viking 0.223838 Poland_Niemcza_MA 0.223659 Poland_Weklice_IA 0.223549 Poland_Kowalewko_IA 0.222584 Poland_Pruszcz_Gdanski_IA 0.222324 Sweden_Viking 0.222091 Russia_Viking 0.222042 Poland_Maslomecz_IA 0.221914 Norway_Viking 0.221825 Denmark_EarlyViking 0.221257 Denmark_Viking 0.221174 England_Viking 0.220979 f3(X,Ireland_Megalithic,Cameroon_SMA) Poland_Maslomecz_IA 0.219816 Poland_Weklice_IA 0.219501 Denmark_Viking 0.2192 Poland_Kowalewko_IA 0.219176 Poland_Ostrow_Lednicki_MA 0.218916 Norway_Viking 0.218854 Poland_Pruszcz_Gdanski_IA 0.218684 Sweden_Viking 0.218626 Denmark_EarlyViking 0.218529 England_Viking 0.218308 Russia_Viking 0.217999 Poland_Viking 0.217914 Poland_Plonsk_MA 0.217756 Poland_Lad_MA 0.217719 Poland_Legowo_MA 0.21765 Poland_Niemcza_MA 0.217001 Poland_Trzciniec_Culture 0.216551Interestingly, the Middle Bronze Age samples associated with the Trzciniec Culture (Poland_Trzciniec_Culture) show a closer genetic relationship to Medieval Poles than to Wielbark Goths or Northwestern Europeans. This is indeed the case both in terms of genome-wide and uniparental markers, including some very specific lineages under Y-chromosome haplogroup R1a. But that's a much more complex issue that I'll leave for another time. So please stay tuned. See also... Slavs have little, if any, Scytho-Sarmatian ancestry
Saturday, November 4, 2023
Slavs have little, if any, Scytho-Sarmatian ancestry
Here's an abstract of a new study from the David Reich Lab about ancient Slavs, titled "Genetic identification of Slavs in Migration Period Europe using an IBD sharing graph". Emphasis is mine:
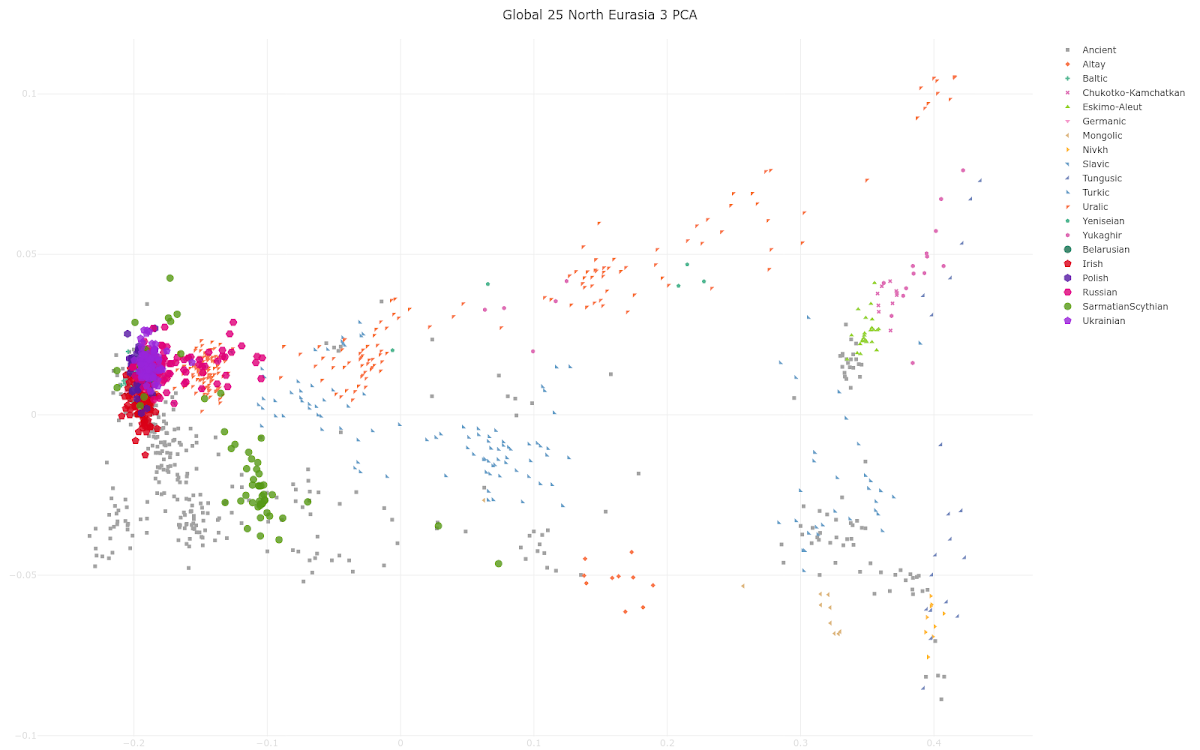 As you can see, dear reader, most of the Slavs (Belarusians, Poles, Ukrainians and many Russians) cluster with the Irish near the western end of the plot.
Some Russians are shifted significantly east of them along the "Uralic cline" and, as a result, they cluster with various Uralic speakers such as Mordovians. That's because when Slavs migrated deep into what is now northern Russia they mixed with Uralic speakers who were there before them.
Most of the Sarmatians and Scythians form a cluster southeast of the Slavs and Irish because they carry significant levels of East Asian ancestry. This type of eastern ancestry is basically missing in modern-day Slavs (see here).
Several of the Scythians cluster among the Slavs and Irish, but that's because they're genetic outliers, whose existence, if anything, suggests that some Scythians had significant Slavic-related and/or Irish-related ancestry.
Now, even though most of the Slavs do cluster with the Irish in the above PCA plot, I strongly disagree with the authors of the abstract when they claim that "differentiating Slavic, Germanic, and Celtic people is very difficult" with PCA. It's actually pretty damn easy and I've been doing it successfully for many years. For instance, see here.
See also...
Wielbark Goths were overwhelmingly of Scandinavian origin
The Caucasus is a semipermeable barrier to gene flow
As you can see, dear reader, most of the Slavs (Belarusians, Poles, Ukrainians and many Russians) cluster with the Irish near the western end of the plot.
Some Russians are shifted significantly east of them along the "Uralic cline" and, as a result, they cluster with various Uralic speakers such as Mordovians. That's because when Slavs migrated deep into what is now northern Russia they mixed with Uralic speakers who were there before them.
Most of the Sarmatians and Scythians form a cluster southeast of the Slavs and Irish because they carry significant levels of East Asian ancestry. This type of eastern ancestry is basically missing in modern-day Slavs (see here).
Several of the Scythians cluster among the Slavs and Irish, but that's because they're genetic outliers, whose existence, if anything, suggests that some Scythians had significant Slavic-related and/or Irish-related ancestry.
Now, even though most of the Slavs do cluster with the Irish in the above PCA plot, I strongly disagree with the authors of the abstract when they claim that "differentiating Slavic, Germanic, and Celtic people is very difficult" with PCA. It's actually pretty damn easy and I've been doing it successfully for many years. For instance, see here.
See also...
Wielbark Goths were overwhelmingly of Scandinavian origin
The Caucasus is a semipermeable barrier to gene flow
Popular methods of genetic analysis relying on allele frequencies such as PCA, ADMIXTURE and qpAdm are not suitable for distinguishing many populations that were important historical actors in the Migration Period Europe. For instance, differentiating Slavic, Germanic, and Celtic people is very difficult relying on these methods, but very helpful for archaeologists given a large proportion of graves with no inventory and frequent adoption of a different culture. To overcome these problems, we applied a method based on autosomal haplotypes. Imputation of missing genotypes and phasing was performed according to a protocol by Rubinacci et al. (2021), and IBD inference was done for ancient Eurasian individuals with data available at >600,000 1240K sites. IBD links for a subset of these individuals were represented as a graph, visualized with a force-directed layout algorithm, and clusters in this graph are inferred with the Leiden algorithm. One of the clusters in the IBD graph emerged that includes nearly all individuals in the dataset annotated archaeologically as “Slavic”. According to PCA a hypothesis for the origin of this population can be proposed: it was formed by admixture of a Baltic-related group with East Germanic people and Sarmatians or Scythians. The individuals belonging to the “Slavic” IBD sharing cluster form a chronological gradient on the PCA plot, with the earliest samples close to the Baltic LBA/EIA group. Later “Slavic” individuals are shifted to the right, closer to Central and Southern Europeans and probably reflecting further admixture of Slavs with local populations during the Migration Period.Apparently this abstract is causing a bit of confusion online because of the mention of possible Sarmatian or Scythian ancestry in Slavs. However, it's important to understand that the authors are referring to certain Slavic or even just Slavic-related individuals, usually from culturally heterogeneous frontier settlements deep in what is now Russia. So yes, it's possible that some of these individuals carry Sarmatian, Scythian or other exotic eastern ancestry. But even if this is true, then obviously we can't extend this inference to all ancient and modern-day Slavs. Indeed, below is a G25/Vahaduo Principal Component Analysis (PCA) that shows why modern-day Slavic speakers can't be linked genetically to Sarmatians or Scythians. To experience a more detailed version of the PCA paste the data here into the relevant field here.

Sunday, July 23, 2023
Dear Sandra, Wolfgang...a problem
In their recent paper, titled Early contact between late farming and pastoralist societies in southeastern Europe, Penske et al. make the following claim:
 I'm pointing this out for two main reasons. First of all, this is a fairly obvious mistake that should've been avoided, especially considering the level of expertise and experience among the authors (such as Wolfgang Haak and Johannes Krause).
Secondly, it's important to understand that the Ozera outlier comes out almost exactly 50% Samara Yamnaya because the standard Yamnaya genotype already existed well before she was alive, and thus she cannot be used to corroborate any sort of influence from the Caucasus in the formation of the mainstream Yamnaya population.
As for the Yamnaya Caucasus individuals, I don't know why Penske et al. attempted to model their ancestry as a group, because they don't form a coherent genetic cluster. RK1001 and ZO2002 are fairly similar to standard Yamnaya samples, while RK1007 and SA6010 resemble Eneolithic steppe samples from the Progress burial site. This is what happens when I try to reproduce the Penske et al. model with my outgroups.
I'm pointing this out for two main reasons. First of all, this is a fairly obvious mistake that should've been avoided, especially considering the level of expertise and experience among the authors (such as Wolfgang Haak and Johannes Krause).
Secondly, it's important to understand that the Ozera outlier comes out almost exactly 50% Samara Yamnaya because the standard Yamnaya genotype already existed well before she was alive, and thus she cannot be used to corroborate any sort of influence from the Caucasus in the formation of the mainstream Yamnaya population.
As for the Yamnaya Caucasus individuals, I don't know why Penske et al. attempted to model their ancestry as a group, because they don't form a coherent genetic cluster. RK1001 and ZO2002 are fairly similar to standard Yamnaya samples, while RK1007 and SA6010 resemble Eneolithic steppe samples from the Progress burial site. This is what happens when I try to reproduce the Penske et al. model with my outgroups.
By contrast, Yamnaya Caucasus individuals from the southern steppe can be modelled as a two-way model of around 76% Steppe Eneolithic and 26% Caucasus Eneolithic/Maykop, confirming the findings of Lazaridis and colleagues 47. This two-way mix (40% + 60%, respectively) also provides a well-fit model (P = 0.09) for the Ozera outlier individual, consistent with the position in PCA and corroborating an influence from the Caucasus.Err, nope. The Ozera Yamnaya outlier, a female dated to 3096-2913 calBCE, is, in fact, a ~50/50 mix between standard Yamnaya and Late Maykop. It's a result that is totally unambiguous. There are a number of ways to demonstrate this fact. For example, with the qpAdm software that was also used by Penske et al., except with different outgroups or right pops. Please note that in my dataset the Ozera outlier is labeled Ukraine_Ozera_EBA_Yamnaya_o.
right pops: Cameroon_SMA Levant_N Iran_GanjDareh_N Iran_C_SehGabi Georgia_HG Turkey_N Serbia_IronGates_Mesolithic Russia_WestSiberia_HG Russia_Karelia_HG Latvia_HG Russia_Boisman_MN Brazil_LapaDoSanto_9600BP Ukraine_Ozera_EBA_Yamnaya_o Russia_Caucasus_EneolithicMaykop 0.554±0.031 Russia_Steppe_Eneolithic 0.446±0.031 P-value 0.00109868 (FAIL) Ukraine_Ozera_EBA_Yamnaya_o Russia_LateMaykop 0.512±0.035 Russia_Samara_EBA_Yamnaya 0.488±0.035 P-value 0.462447 (PASS)I can also do it with the Global25/Vahaduo method. And you, dear reader, can too, by putting the Target and Source Global25 coords from the text file here into the relevant fields here.
Target: Ukraine_Ozera_EBA_Yamnaya_o Distance: 2.9292% / 0.02929202 50.6 Russia_Samara_EBA_Yamnaya 49.4 Russia_Caucasus_LateMaykop 0.0 Russia_Caucasus_EneolithicMaykop 0.0 Russia_Steppe_EneolithicMoreover, here's a self-explanatory Principal Component Analysis (PCA) plot that illustrates why my Late Maykop/Samara Yamnaya combo is much better than the reference populations used by Penske and colleagues. It was done with the PCA tools here.

Russia_Caucasus_EBA_Yamnaya Russia_Caucasus_EneolithicMaykop 0.187±0.019 Russia_Steppe_Eneolithic 0.813±0.019 P-value 4.15842e-06 (HARD FAIL)Oh, and Penske et al. modeled the ancestry of mainstream Yamnaya as a three-way mixture with Steppe Eneolithic, Caucasus Eneolithic/Maykop and Ukraine Neolithic (or Ukraine N). They succeeded, but with my outgroups it's another hard fail.
Russia_Samara_EBA_Yamnaya Russia_Caucasus_EneolithicMaykop 0.177±0.017 Russia_Steppe_Eneolithic 0.706±0.026 Ukraine_N 0.116±0.014 P-value 4.73919e-07 (HARD FAIL)Admittedly, proximal models aren't easy to get right. And if you throw enough outgroups into a model, a large proportion of plausible models will fail. But I'm somewhat taken aback by these poor statistical fits. In my opinion, mainstream Yamnaya doesn't harbor any Caucasus ancestry that wasn't already present on the Pontic-Caspian steppe during the Eneolithic or even much earlier (see here). But ultimately this problem can only be solved with direct evidence from ancient DNA, so let's now wait patiently for the right samples. Citation... Penske et al., Early contact between late farming and pastoralist societies in southeastern Europe, Nature, https://doi.org/10.1038/s41586-023-06334-8 See also... Understanding the Eneolithic steppe
Monday, September 19, 2022
Dear Iosif...Yamnaya
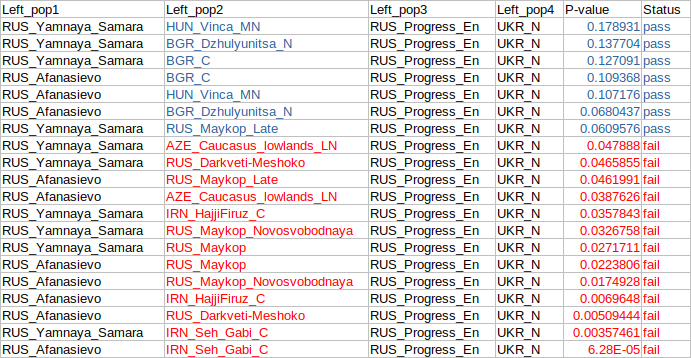
Even though the Yamnaya culture probably originated in what is now Ukraine, the earliest Yamnaya samples currently available are from the modern-day Samara region of Russia. They mostly date to around 3,000 BCE. I can analyze their ancestry using Principal Component Analysis (PCA) data.
 Importantly, qpAdm needs to be fed the relevant "right pop" outgroups to be able to discriminate accurately between reference populations.
Target: RUS_Yamnaya_Samara Distance: 3.2816% / 0.03281581 81.0 RUS_Progress_En 14.4 UKR_N 4.6 HUN_Vinca_MN 0.0 ARM_Aknashen_N 0.0 ARM_Masis_Blur_N 0.0 AZE_Caucasus_lowlands_LN 0.0 BGR_C 0.0 BGR_Dzhulyunitsa_N 0.0 IRN_Ganj_Dareh_N 0.0 IRN_Hajji_Firuz_C 0.0 IRN_Seh_Gabi_C 0.0 IRN_Tepe_Abdul_Hosein_N 0.0 IRN_Wezmeh_N 0.0 RUS_Darkveti-Meshoko_En 0.0 RUS_Maykop 0.0 RUS_Maykop_Late 0.0 RUS_Maykop_NovosvobodnayaThe above results show exactly zero ancestry from West Asia. Admittedly, both RUS_Progress_En and HUN_Vinca_MN are European ancients with significant West Asian-related ancestry. However, this ancestry is very distantly West Asian-related, and, for instance, it almost certainly has no relevance to the Indo-Anatolian homeland debate. The Afanasievo culture of Central Asia is regarded to have been an early offshoot of the Yamnaya culture. A good number of Afanasievo samples are available, so let's have a look if their results match those of the Yamnaya folks. And indeed they do, since BGR_C is very similar to HUN_Vinca_MN.
Target: RUS_Afanasievo Distance: 3.4055% / 0.03405499 84.0 RUS_Progress_En 11.4 UKR_N 4.6 BGR_C 0.0 ARM_Aknashen_N 0.0 ARM_Masis_Blur_N 0.0 AZE_Caucasus_lowlands_LN 0.0 BGR_Dzhulyunitsa_N 0.0 HUN_Vinca_MN 0.0 IRN_Ganj_Dareh_N 0.0 IRN_Hajji_Firuz_C 0.0 IRN_Seh_Gabi_C 0.0 IRN_Tepe_Abdul_Hosein_N 0.0 IRN_Wezmeh_N 0.0 RUS_Darkveti-Meshoko_En 0.0 RUS_Maykop 0.0 RUS_Maykop_Late 0.0 RUS_Maykop_NovosvobodnayaTo try this at home, stick the PCA data in the text file here into the relevant fields here and cranck up the "Cycles" to 4X. You should see exactly zero ancestry from West Asia every time. I can, more or less, reproduce these results with tools that are routinely used in peer reviewed papers. Below is a table of mixture models produced with the qpAdm software. I set the pass threshold to P ≥0.05, which is an arbitrary value, but the pattern is clear. The full output from each qpAdm run is available here.
right pops: CMR_Shum_Laka_8000BP MAR_Taforalt Levant_Natufian IRN_Ganj_Dareh_N Levant_PPNB TUR_Marmara_Barcin_N HUN_Starcevo_N HUN_Koros_N SRB_Iron_Gates_HG Iberia_Southeast_Meso RUS_Karelia_HG RUS_West_Siberia_HG RUS_Boisman_MN MNG_North_N TWN_Hanben BRA_LapaDoSanto_9600BPSo, for instance, if one were to use in this role the modern-day Mbuti people, as opposed to, say, the ancient hunter-gatherers of Shum Laka, one might find that many models look statistically better than they should. And then one might also find that the Yamnaya samples carry significant West Asian ancestry. Actually, I'm not opposed to the idea of some West Asian ancestry in Yamnaya. Indeed, considering the extraordinary mobility of the Yamnaya people and their Eneolithic predecessors on the Pontic-Caspian steppe, it would be unusual if they didn't come into close contact and mix, to some degree, with their neighbors from West Asia. However, based on everything I've seen, from uniparental markers to different types of autosomal genetic tests, it's clear to me that there's no substantial West Asian ancestry in any Yamnaya samples, except for an outlier female from modern-day Ozera, Ukraine (see here). Admittedly, ancient DNA does have a habit of throwing curveballs, so I'm eagerly awaiting new Eneolithic samples from the Pontic-Caspian steppe, particularly those associated with the Yamnaya-like Sredni Stog culture, to help finally settle this issue. Believe it or not, a contact recently sent me a supposedly unpublished female sample from a ~4,200 BCE Sredni Stog burial in modern-day Igren, east central Ukraine. So what the hell, let's assume for the time being that this sample is genuine. This is how Miss Sredni Stog behaves in my PCA mixture test.
Target: UKR_Sredni_Stog Distance: 4.0769% / 0.04076877 75.6 RUS_Progress_En 17.8 UKR_N 6.6 HUN_Vinca_MN 0.0 ARM_Aknashen_N 0.0 ARM_Masis_Blur_N 0.0 AZE_Caucasus_lowlands_LN 0.0 BGR_C 0.0 BGR_Dzhulyunitsa_N 0.0 HUN_Vinca_MN 0.0 IRN_Ganj_Dareh_N 0.0 IRN_Hajji_Firuz_C 0.0 IRN_Seh_Gabi_C 0.0 IRN_Tepe_Abdul_Hosein_N 0.0 IRN_Wezmeh_N 0.0 RUS_Darkveti-Meshoko_En 0.0 RUS_Maykop 0.0 RUS_Maykop_Late 0.0 RUS_Maykop_NovosvobodnayaWow, just wow. Have we actually found Miss Proto-Yamnaya? What does qpAdm have to say in the matter?
UKR_Sredni_Stog HUN_Vinca_MN 0.034±0.028 RUS_Progress_En 0.796±0.045 UKR_N 0.170±0.034 P-value 0.41088Again, this is an excellent match with the results from my PCA test, especially if we take into account the standard errors. However, with qpAdm it's also possible to model this individual's ancestry as part West Asian.
UKR_Sredni_Stog AZE_Caucasus_lowlands_LN 0.056±0.039 RUS_Progress_En 0.761±0.061 UKR_N 0.183±0.036 P-value 0.465667As I pointed out above, it's plausible for such people to harbor some West Asian ancestry, but I'm very sceptical that this is really the case here, despite the rather solid qpAdm statistical fit. That's because UKR_Sredni_Stog is not a high quality sample, and, from my experience, qpAdm often has problems analyzing fine scale ancestry in singletons or even small groups that show excess DNA damage and/or offer much less than a million markers. See also... Dear Iosif, about that ~2% But Iosif, what about the Phrygians?
Friday, August 7, 2020
New Global25 interpretation tools
They're available at Ancestry Calculator and GENOPLOT. Unfortunately, I can't tell you exactly how to get the most out of them. All I can recommend is robust experimentation.
 See also...
Getting the most out of the Global25
Genetic ancestry online store
Modeling your ancestry has never been easier
See also...
Getting the most out of the Global25
Genetic ancestry online store
Modeling your ancestry has never been easier
Monday, December 30, 2019
A final note for the year
I feel like I've spent a good part of 2019 banging my head against a thicker than average brick wall.
Much of this feeling is tied to the controversy over the ethnogenesis of the Yamnaya people, and my often futile attempts to explain that their origin cannot be sought in what is now Iran, or, indeed, anywhere outside of Eastern Europe.
This post is my final attempt to lay out the facts in regards to this topic. Next year I'll have better things to do than to argue the bleeding obvious.
Below are two graphs from a Principal Component Analysis (PCA) based on relatively high quality ancient human genotype data from the Caucasus and surrounds. They include two typical Yamnaya individuals from burial sites north of the Caspian Sea. I made the graphs with the Vahaduo Custom PCA tool here. The relevant datasheet can be downloaded here.

 Here's what I'm seeing:

 Yep, the Yamnaya pair appears to be peeling away very slightly, but deliberately, from the Steppe_Eneolithic individuals towards the part of the plot occupied by the farmers.
Admittedly, I'm no Sherlock Holmes, but even with my fairly average sleuthing abilities, I'm pretty sure I know how the Yamnaya people came to be. They formed largely on the base of a population very much like Steppe_Eneolithic somewhere deep in Eastern Europe, well to the north of the Caucasus, and nowhere near the Iranian Plateau.
See also...
A note on Steppe Maykop
Yep, the Yamnaya pair appears to be peeling away very slightly, but deliberately, from the Steppe_Eneolithic individuals towards the part of the plot occupied by the farmers.
Admittedly, I'm no Sherlock Holmes, but even with my fairly average sleuthing abilities, I'm pretty sure I know how the Yamnaya people came to be. They formed largely on the base of a population very much like Steppe_Eneolithic somewhere deep in Eastern Europe, well to the north of the Caucasus, and nowhere near the Iranian Plateau.
See also...
A note on Steppe Maykop


- the Yamnaya individuals sit on genetic clines made up of hunter-gatherers native to the Caucasus and various parts of Eastern Europe, including a trio from the southernmost part of the Pontic-Caspian steppe (labeled Steppe_Eneolithic), with whom they form a distinct cluster - the samples from the Caucasus and the Iranian Plateau form very different clusters, so there's no support here for the ancient Caucasus/Iranian grouping that is often haphazardly invoked in scientific literature - there's no indication that the Yamnaya and/or Steppe_Eneolithic groups experienced recent gene flow, or, for that matter, any gene flow whatsoever, from what is now Iran.Of course, analyses based on formal statistics suggest that the Yamnaya population harbors minor western ancestry that is missing in Steppe_Eneolithic. In fact, I was first to argue this point (see here). So let's add a couple of ancient farmers from Western Europe to my PCA to see how they affect the graphs. The relevant datasheet is available here.


Saturday, December 14, 2019
Avalon vs Valhalla revisited
Pictured below is a new version of my Celtic vs Germanic genetic map. It's based on the same Principal Component Analysis (PCA) as the original (which can be seen here), but more focused on Northwestern Europe and produced with a different program.
 To see the interactive online version, navigate to Vahaduo Custom PCA and copy paste the text from here into the empty space under the PCA DATA tab. Then press the PLOT PCA button under the PCA PLOT tab. For more guidance, refer to the screen caps here and here.
To include a wider range of populations in the key, just edit the data accordingly. For instance, to break up the ancient grouping into more specific populations, delete the Ancient: prefix in all of the relevant rows. This is what you should see:
To see the interactive online version, navigate to Vahaduo Custom PCA and copy paste the text from here into the empty space under the PCA DATA tab. Then press the PLOT PCA button under the PCA PLOT tab. For more guidance, refer to the screen caps here and here.
To include a wider range of populations in the key, just edit the data accordingly. For instance, to break up the ancient grouping into more specific populations, delete the Ancient: prefix in all of the relevant rows. This is what you should see:
 Conversely, you can leave the ancient sample set intact and instead reorder the present-day linguistic groupings into, say, geographic groupings. To achieve this just delete all of the linguistic prefixes, such as Celtic:, Germanic:, and so on. You should end up with a datasheet like this and plot like this.
Of course, you can design your own plot by using any combination of the ancient and present-day individuals and populations that I've already run in this PCA. Their coordinates are listed here. Indeed, if you're in the possession of your own Celtic vs Germanic PCA coordinates, you can add yourself to the plot. And if you're not, see here.
It's also possible to re-process PCA data via the SOURCE tab. But I don't recommend doing this with the Celtic vs Germanic data, which are derived from a fine scale analysis and don't pack much variation. On the other hand, Global25 data are ideal for such re-processing. I made the plots below from subsets of Global25 coordinates available in a zip file here. To see how, refer to the screen caps here and here.
Conversely, you can leave the ancient sample set intact and instead reorder the present-day linguistic groupings into, say, geographic groupings. To achieve this just delete all of the linguistic prefixes, such as Celtic:, Germanic:, and so on. You should end up with a datasheet like this and plot like this.
Of course, you can design your own plot by using any combination of the ancient and present-day individuals and populations that I've already run in this PCA. Their coordinates are listed here. Indeed, if you're in the possession of your own Celtic vs Germanic PCA coordinates, you can add yourself to the plot. And if you're not, see here.
It's also possible to re-process PCA data via the SOURCE tab. But I don't recommend doing this with the Celtic vs Germanic data, which are derived from a fine scale analysis and don't pack much variation. On the other hand, Global25 data are ideal for such re-processing. I made the plots below from subsets of Global25 coordinates available in a zip file here. To see how, refer to the screen caps here and here.


 See also...
Modeling your ancestry has never been easier
Getting the most out of the Global25
Modeling genetic ancestry with Davidski: step by step
See also...
Modeling your ancestry has never been easier
Getting the most out of the Global25
Modeling genetic ancestry with Davidski: step by step


Monday, November 25, 2019
Viking Age Iceland
I finally managed to get some of the Icelandic ancients from Ebenesersdóttir et al. 2018 into the Global25 datasheets (see here). Better late than never. Look for the"ISL_Viking_Age" prefix. Below is a screen cap of a Principal Component Analysis (PCA) with the new samples. It was done with an online Global25 PCA runner freely available here.
 The individuals classified as unadmixed Gaels and Norse by Ebenesersdóttir et al. generally also look like it based on their Global25 coordinates.
The mixture models below, using all of the populations from the Global25 "modern pop averages scaled" datasheet, were run with an online tool freely available here. Note that the ADD DIST COL option is set to 1X. This is a useful feature for modeling the fine scale ancestry of samples that are derived from very similar populations.
The individuals classified as unadmixed Gaels and Norse by Ebenesersdóttir et al. generally also look like it based on their Global25 coordinates.
The mixture models below, using all of the populations from the Global25 "modern pop averages scaled" datasheet, were run with an online tool freely available here. Note that the ADD DIST COL option is set to 1X. This is a useful feature for modeling the fine scale ancestry of samples that are derived from very similar populations.


 See also...
They came, they saw, and they mixed
Commoner or elite?
Who were the people of the Nordic Bronze Age?
See also...
They came, they saw, and they mixed
Commoner or elite?
Who were the people of the Nordic Bronze Age?


Tuesday, November 5, 2019
Modeling your ancestry has never been easier
An exceedingly simple, yet feature-packed, online tool ideal for modeling ancestry with Global25 coordinates is freely available HERE. It works offline too, after downloading the web page onto your computer. Just copy paste the coordinates of your choice under the "source" and "target" tabs, and then mess around with the buttons to see what happens. The screen caps below show me doing just that.
Another free, easy to use online tool that works with Global25 coordinates is the Principal Component Analysis (PCA) runner HERE. Below is a screen cap of me checking out one of the many PCA that it offers.
 See also...
Getting the most out of the Global25
See also...
Getting the most out of the Global25

Friday, July 12, 2019
Getting the most out of the Global25
The first thing you need to know about the Global25 is that I update the relevant datasheets regularly, usually every few weeks, but they're always at these links:
 To start the mixture modeling process, type or copy paste getMonte('data.txt', 'target.txt') into the R console window, hit "enter", and wait for the results. After a short time, probably less than a minute or two, you should see this output.
 The data and target files contain population averages. And, as you can see, the results that these population averages have produced are in line with what one would expect from such a model focusing on the genetic shifts in Northern Europe during the Late Neolithic. Very similar ancient ancestry proportions have been reported for the English and other Northern Europeans recently in scientific literature.
However, when focusing on exceptionally fine-scale genetic variation that isn't reflected too well in the Global25 population averages, a more effective strategy might be to use multiple individuals from each reference population and let nMonte3 aggregate and average the inferred ancestry proportions.
This is often the case when attempting to model ancestry proportions for more recent periods, such as the Middle Ages. So let's try this with the English sample set using a modified data file, which is available here.
Replace the old data file with the new one in your working directory, and, like before, copy paste into the R console window the following two commands, hitting "enter" after each one: source('nMonte3.R') and getMonte('data.txt', 'target.txt'). This is what you should eventually see.
The data and target files contain population averages. And, as you can see, the results that these population averages have produced are in line with what one would expect from such a model focusing on the genetic shifts in Northern Europe during the Late Neolithic. Very similar ancient ancestry proportions have been reported for the English and other Northern Europeans recently in scientific literature.
However, when focusing on exceptionally fine-scale genetic variation that isn't reflected too well in the Global25 population averages, a more effective strategy might be to use multiple individuals from each reference population and let nMonte3 aggregate and average the inferred ancestry proportions.
This is often the case when attempting to model ancestry proportions for more recent periods, such as the Middle Ages. So let's try this with the English sample set using a modified data file, which is available here.
Replace the old data file with the new one in your working directory, and, like before, copy paste into the R console window the following two commands, hitting "enter" after each one: source('nMonte3.R') and getMonte('data.txt', 'target.txt'). This is what you should eventually see.
 It's difficult to say how accurate these estimates are. But they look more or less correct considering the limited and less than ideal reference samples. For instance, the individuals labeled SWE_Viking_Age_Sigtuna are supposed to be stand ins for Danish and Norwegian Vikings, but they're a relatively heterogeneous group from Sweden, possibly with some British or Irish ancestry, so they might be skewing the results.
However, I'll be adding many more ancient samples to the Global25 datasheets as they become available, including lots of new Vikings, which should greatly improve the accuracy of these sorts of fine-scale mixture models.
An exceedingly simple, yet feature-packed, online tool ideal for modeling ancestry with Global25 coordinates is the VahaduoJS. It's freely available HERE, and it also works offline after downloading the web page. Just copy paste the coordinates of your choice under the "source" and "target" tabs, and then mess around with the buttons to see what happens. The screen caps below show me doing just that.
However, it's important to note that the Global25 is a Principal Component Analysis (PCA), so it makes good sense to also use it for producing PCA graphs. To do this just plot any combination of two or three of its Principal Components (PCs) to create 2D or 3D graphs, respectively. This can be done with a wide variety of programs, including PAST, which is freely available here.
To produce a 2D graph, open a Global25 datasheet in PAST, choose comma as the separator, highlight any two columns of data, click on the "Plot" tab and, from the drop down list, pick "XY graph". Below is a series of graphs that I created in exactly this way. I also color coded the samples according to their geographic origins. This was done by ticking the "Row attributes" tab.
It's difficult to say how accurate these estimates are. But they look more or less correct considering the limited and less than ideal reference samples. For instance, the individuals labeled SWE_Viking_Age_Sigtuna are supposed to be stand ins for Danish and Norwegian Vikings, but they're a relatively heterogeneous group from Sweden, possibly with some British or Irish ancestry, so they might be skewing the results.
However, I'll be adding many more ancient samples to the Global25 datasheets as they become available, including lots of new Vikings, which should greatly improve the accuracy of these sorts of fine-scale mixture models.
An exceedingly simple, yet feature-packed, online tool ideal for modeling ancestry with Global25 coordinates is the VahaduoJS. It's freely available HERE, and it also works offline after downloading the web page. Just copy paste the coordinates of your choice under the "source" and "target" tabs, and then mess around with the buttons to see what happens. The screen caps below show me doing just that.
However, it's important to note that the Global25 is a Principal Component Analysis (PCA), so it makes good sense to also use it for producing PCA graphs. To do this just plot any combination of two or three of its Principal Components (PCs) to create 2D or 3D graphs, respectively. This can be done with a wide variety of programs, including PAST, which is freely available here.
To produce a 2D graph, open a Global25 datasheet in PAST, choose comma as the separator, highlight any two columns of data, click on the "Plot" tab and, from the drop down list, pick "XY graph". Below is a series of graphs that I created in exactly this way. I also color coded the samples according to their geographic origins. This was done by ticking the "Row attributes" tab.
 PAST can also be used to run PCA on subsets of the Global25 scaled data to produce remarkably accurate plots of fine-scale population structure. For instance, here's a plot based on present-day populations from north of the Alps, Balkans and Pyrenees.
 To try this create a new text file with your choice of populations from the Global25 scaled datasheet, open it with PAST and choose Multivariate > Ordination > Principal Components Analysis. I've already put together several datasheets limited to European, Northern European, West Eurasian and South Asian populations. They're available at the links below along with more details on how to run them with PAST.
And if you're fond of tree-like structures as a means to describe fine-scale genetic variation, please see this blog post...
To try this create a new text file with your choice of populations from the Global25 scaled datasheet, open it with PAST and choose Multivariate > Ordination > Principal Components Analysis. I've already put together several datasheets limited to European, Northern European, West Eurasian and South Asian populations. They're available at the links below along with more details on how to run them with PAST.
And if you're fond of tree-like structures as a means to describe fine-scale genetic variation, please see this blog post...
Global25 datasheet ancient scaled Global25 pop averages ancient scaled Global25 datasheet ancient Global25 pop averages ancient ... Global25 datasheet modern scaled Global25 pop averages modern scaled Global25 datasheet modern Global25 pop averages modernGlobal25 data for samples from a variety of papers that have been published recently will eventually be incorporated into the main datasheets linked above, but the process might take several weeks or even months. In the meantime, feel free to use the temporary datasheets below. Thanks for your patience.
Allentoft 2023 Chylenski 2023 Jeong 2024 Koptekin 2022 Olalde 2023 Peltola 2022 Penske 2023 Posth 2023 Sirak 2024 Skourtanioti 2023 Stolarek 2023 Varela 2023 Wang 2023 Yu 2023Each sample has a population code and an individual code. The population codes represent the countries, ethnic groups and/or archeological affinities of the samples, and I often modify these codes to suit my needs. On the other hand, the individual codes are unique to most of the samples and I usually don't change them. So if you'd like to know more details about the samples try searching for their individual codes via a decent online search engine. Basic information about many of the samples is also available in the "anno" files here. The main purpose of the Global25 is to provide data for mixture modeling. In other words, for estimating ancestry proportions, both ancient and modern (see here). This can be done on your computer with the R program and the nMonte R script, or online with a couple of different tools, which I discuss below. If you don't have R installed on your computer, you can get it here, while nMonte is available here. For this tutorial please download nMonte and nMonte3, and store them in your main working folder (usually My Documents). Once you have R set up, make sure its working directory is the same place where you stored nMonte. You can check this in R by clicking on "File" and then "Change dir". Additionally, you'll need two nMonte input files in the working directory titled "data" and "target". Examples of these files are available here. We'll be using them to test the ancient ancestry proportions of a sample set from present-day England. Before you can begin the analysis you need to first call the nMonte script by typing or copy pasting source('nMonte.R') into the R console window, and then hitting "enter" on your keyboard. This is what you should see in the R console window afterwards.


Global25 workshop 1: that classic West Eurasian plot Global25 workshop 2: intra-European variation Global25 workshop 3: genes vs geography in Northern Europe The South Asian cline that no longer existsAnother free, easy to use online tool that works with Global25 coordinates is the Vahaduo Global25 Views [LINK]. Below is a screen cap of me checking out one of the many PCA that it offers.
Global25 workshop 4: a neighbour joining treeSee also... New Global25 interpretation tools
Saturday, May 11, 2019
Uralic-specific genome-wide ancestry did make a signifcant impact in the East Baltic
I've started analyzing the ancient genotype data from the recent Saag et al. paper on the expansion of Uralic languages and associated spread of Siberian ancestry into the East Baltic region. The paper is freely available here and the data are here.
I really like the paper, but I don't agree with the authors' claim that the appearance of Y-chromosome haplogroup N in what is now Estonia and surrounds during the Iron Age is "not matched by a clear shift in autosomal profiles". In my opinion it certainly is, and, as one would expect, it's a shift towards a genetic profile typical of western Uralic speakers.
I'd say that the easiest way to find this signal is with a Principal Component Analysis (PCA) focusing on fine scale genetic substructures within Northern Europe, like the one below. The relevant datasheet is available here.
 Note that the East Baltic Iron Age samples, all from burial sites in what is now Estonia, appear to be peeling away from their Bronze Age predecessors and overlapping strongly with present-day Estonians, who are Uralic speakers. Indeed, the PCA suggests to me that the formation of the greater part of the present-day Estonian gene pool took place in the East Baltic during the transition from the Bronze Age to the Iron Age. That is, when Uralic languages are generally accepted to have arrived in the region from near the Ural Mountains in the east.
I was also able to closely replicate these outcomes with my Global25 data using the method described here. However, in this effort, present-day Estonians are clearly more western than the Estonian Iron Age samples (EST_IA), which might be due to the presence of low level Germanic ancestry in Estonia dating to the medieval period. The relevant datasheet is available here.
Note that the East Baltic Iron Age samples, all from burial sites in what is now Estonia, appear to be peeling away from their Bronze Age predecessors and overlapping strongly with present-day Estonians, who are Uralic speakers. Indeed, the PCA suggests to me that the formation of the greater part of the present-day Estonian gene pool took place in the East Baltic during the transition from the Bronze Age to the Iron Age. That is, when Uralic languages are generally accepted to have arrived in the region from near the Ural Mountains in the east.
I was also able to closely replicate these outcomes with my Global25 data using the method described here. However, in this effort, present-day Estonians are clearly more western than the Estonian Iron Age samples (EST_IA), which might be due to the presence of low level Germanic ancestry in Estonia dating to the medieval period. The relevant datasheet is available here.
 Interestingly, the Estonian Bronze Age samples (EST_BA) come from stone-cist graves which are widely hypothesized to have been introduced to the East Baltic from the Nordic Bronze Age civilization. I even recall reading a paper on the topic which claimed that the remains buried in such graves were those of Proto-Germanic-speaking Scandinavian migrants. Well, I haven't had a chance to study these samples in any great detail yet, but considering that in both of the PCA above they're overlapping strongly with Latvian Bronze Age samples (LVA_BA) and sitting far away from the nearest Scandinavians, I'd say they're probably of local stock from way back.
See also...
It was always going to be this way
On the association between Uralic expansions and Y-haplogroup N
Inferring the linguistic affinity of long dead and non-literate peoples: a multidisciplinary approach
Interestingly, the Estonian Bronze Age samples (EST_BA) come from stone-cist graves which are widely hypothesized to have been introduced to the East Baltic from the Nordic Bronze Age civilization. I even recall reading a paper on the topic which claimed that the remains buried in such graves were those of Proto-Germanic-speaking Scandinavian migrants. Well, I haven't had a chance to study these samples in any great detail yet, but considering that in both of the PCA above they're overlapping strongly with Latvian Bronze Age samples (LVA_BA) and sitting far away from the nearest Scandinavians, I'd say they're probably of local stock from way back.
See also...
It was always going to be this way
On the association between Uralic expansions and Y-haplogroup N
Inferring the linguistic affinity of long dead and non-literate peoples: a multidisciplinary approach
Sunday, September 16, 2018
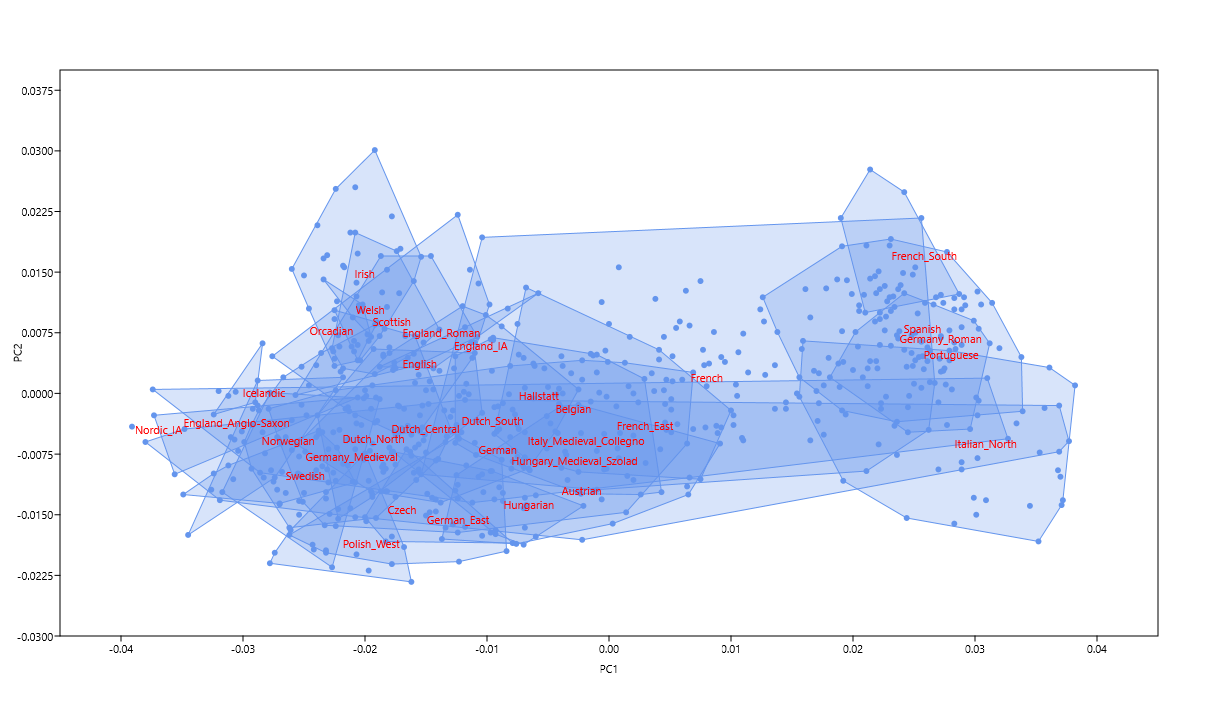
Celtic vs Germanic Europe
I have a feeling that ancient DNA from post-Bronze Age Northwestern Europe will be coming thick and fast from now on. To get the most out of such data I've designed a new Principal Component Analysis (PCA) that does a better job of separating the Celtic- and Germanic-speaking populations of Europe than my previous efforts of this sort (see here and here). Below are two different versions of the same PCA. The relevant datasheet is available here.

 And here's a Discrimination Analysis (LDA) plot based on the 25 principal components. It further differentiates many of the populations along the east > west cline of genetic diversity.
 The difference between the Germanic Anglo-Saxons and the Celtic and Roman Britons of what is now eastern England is obvious. The Anglo-Saxons could pass for Scandinavians, while the Celts and Romans both cluster between the Irish and French. This makes good sense, and is exactly what I was looking for. It's also interesting to see the presumably Celtic-speaking Hallstatt samples from Bylany, Czechia, clustering with the Belgians.
Update 14/12/2019: Pictured below is a new version of my Celtic vs Germanic genetic map. It's based on the same Principal Component Analysis (PCA) as the original, but more focused on Northwestern Europe and produced with a different program.
To see the interactive online version, navigate to Vahaduo Custom PCA and copy paste the text from here into the empty space under the PCA DATA tab. Then press the PLOT PCA button under the PCA PLOT tab. For more guidance, refer to the screen caps here and here.
To include a wider range of populations in the key, just edit the data accordingly. For instance, to break up the ancient grouping into more specific populations, delete the Ancient: prefix in all of the relevant rows. This is what you should see:
Conversely, you can leave the ancient sample set intact and instead reorder the present-day linguistic groupings into, say, geographic groupings. To achieve this just delete all of the linguistic prefixes, such as Celtic:, Germanic:, and so on. You should end up with a datasheet like this and plot like this.
Of course, you can design your own plot by using any combination of the ancient and present-day individuals and populations that I've already run in this PCA. Their coordinates are listed here. Indeed, if you're in the possession of your own Celtic vs Germanic PCA coordinates, you can add yourself to the plot. And if you're not, see here.
It's also possible to re-process PCA data via the SOURCE tab. But I don't recommend doing this with the Celtic vs Germanic data, which are derived from a fine scale analysis and don't pack much variation. On the other hand, Global25 data are ideal for such re-processing. I made the plots below from subsets of Global25 coordinates available in a zip file here. To see how, refer to the screen caps here and here.
See also...
Modeling your ancestry has never been easier
Getting the most out of the Global25
Modeling genetic ancestry with Davidski: step by step
The difference between the Germanic Anglo-Saxons and the Celtic and Roman Britons of what is now eastern England is obvious. The Anglo-Saxons could pass for Scandinavians, while the Celts and Romans both cluster between the Irish and French. This makes good sense, and is exactly what I was looking for. It's also interesting to see the presumably Celtic-speaking Hallstatt samples from Bylany, Czechia, clustering with the Belgians.
Update 14/12/2019: Pictured below is a new version of my Celtic vs Germanic genetic map. It's based on the same Principal Component Analysis (PCA) as the original, but more focused on Northwestern Europe and produced with a different program.
To see the interactive online version, navigate to Vahaduo Custom PCA and copy paste the text from here into the empty space under the PCA DATA tab. Then press the PLOT PCA button under the PCA PLOT tab. For more guidance, refer to the screen caps here and here.
To include a wider range of populations in the key, just edit the data accordingly. For instance, to break up the ancient grouping into more specific populations, delete the Ancient: prefix in all of the relevant rows. This is what you should see:
Conversely, you can leave the ancient sample set intact and instead reorder the present-day linguistic groupings into, say, geographic groupings. To achieve this just delete all of the linguistic prefixes, such as Celtic:, Germanic:, and so on. You should end up with a datasheet like this and plot like this.
Of course, you can design your own plot by using any combination of the ancient and present-day individuals and populations that I've already run in this PCA. Their coordinates are listed here. Indeed, if you're in the possession of your own Celtic vs Germanic PCA coordinates, you can add yourself to the plot. And if you're not, see here.
It's also possible to re-process PCA data via the SOURCE tab. But I don't recommend doing this with the Celtic vs Germanic data, which are derived from a fine scale analysis and don't pack much variation. On the other hand, Global25 data are ideal for such re-processing. I made the plots below from subsets of Global25 coordinates available in a zip file here. To see how, refer to the screen caps here and here.
See also...
Modeling your ancestry has never been easier
Getting the most out of the Global25
Modeling genetic ancestry with Davidski: step by step


Subscribe to:
Posts (Atom)