search this blog

Showing posts with label Poles. Show all posts

Friday, November 10, 2023

Wielbark Goths were overwhelmingly of Scandinavian origin


When used properly, Principal Component Analysis (PCA) is an extraordinarily powerful tool and one of the best ways to study fine-scale genetic substructures within Europe.

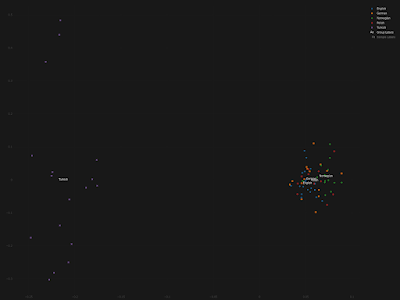
The PCA plot below is based on Global25 data and focuses on the genetic relationship between Wielbark Goths and Medieval Poles, including from the Viking Age, in the context of present-day European genetic variation.


I'd say that it's a wonderfully self-explanatory plot, but here are some key observations:

- the Wielbark Goths (Poland_Wielbark_IA) and Medieval Poles (Poland_Middle_Ages) are two distinct populations

- moreover, the Wielbark Goths form a relatively compact Scandinavian-related cluster and must surely represent a homogenous population overwhelmingly of Scandinavian origin

- on the other hand, the Medieval Poles form a more extensive and heterogeneous cluster that overlaps with present-day groups all the way from Central Europe to the East Baltic, and that's because they are likely to be in large part of mixed origin

- I know for a fact that at least some of these early Poles harbor recent admixture, because their burials are similar to those of Vikings and their haplotypes have been shown to be partly of Scandinavian origin (see here)

- one of the Wielbark females is an obvious genetic outlier (Poland_Wielbark_IA_outlier), and basically looks like a first generation mixture between a Goth and a Balt.

Please note that the PCA is only based on relatively high quality genomes, so as not to confuse the picture with spurious results and noise. Also, all outliers with potentially significant ancestry from outside of Central, Eastern and Northern Europe were removed from the analysis. The relevant datasheet is available here.

However, sanity checks are always important when studying complex topics like fine-scale genetic ancestry. To that end I've prepared a graph based on f3-statistics of the form f3(X,Cameroon_SMA,Estonia_BA)/(X,Cameroon_SMA,Ireland_Megalithic), that reproduces the key features of my PCA. The relevant datasheet is available here.

Polish groups from the Middle Ages are marked with the MA suffix, while the Iron Age Wielbark Goths are marked with the IA suffix.

If you're wondering why I plotted the f3-statistics that I did, take a look at this (all groups largely of Scandinavian origin are emboldened):

f3(X,Estonia_BA,Cameroon_SMA)
Poland_Legowo_MA 0.226406
Poland_Ostrow_Lednicki_MA 0.225996
Poland_Plonsk_MA 0.225017
Poland_Trzciniec_Culture 0.224215
Poland_Lad_MA 0.224142
Poland_Viking 0.223838
Poland_Niemcza_MA 0.223659
Poland_Weklice_IA 0.223549
Poland_Kowalewko_IA 0.222584
Poland_Pruszcz_Gdanski_IA 0.222324
Sweden_Viking 0.222091
Russia_Viking 0.222042
Poland_Maslomecz_IA 0.221914
Norway_Viking 0.221825
Denmark_EarlyViking 0.221257
Denmark_Viking 0.221174
England_Viking 0.220979

f3(X,Ireland_Megalithic,Cameroon_SMA)
Poland_Maslomecz_IA 0.219816
Poland_Weklice_IA 0.219501
Denmark_Viking 0.2192
Poland_Kowalewko_IA 0.219176
Poland_Ostrow_Lednicki_MA 0.218916
Norway_Viking 0.218854
Poland_Pruszcz_Gdanski_IA 0.218684
Sweden_Viking 0.218626
Denmark_EarlyViking 0.218529
England_Viking 0.218308
Russia_Viking 0.217999
Poland_Viking 0.217914
Poland_Plonsk_MA 0.217756
Poland_Lad_MA 0.217719
Poland_Legowo_MA 0.21765
Poland_Niemcza_MA 0.217001
Poland_Trzciniec_Culture 0.216551

Interestingly, the Middle Bronze Age samples associated with the Trzciniec Culture (Poland_Trzciniec_Culture) show a closer genetic relationship to Medieval Poles than to Wielbark Goths or Northwestern Europeans. This is indeed the case both in terms of genome-wide and uniparental markers, including some very specific lineages under Y-chromosome haplogroup R1a.

But that's a much more complex issue that I'll leave for another time. So please stay tuned.

See also...

Slavs have little, if any, Scytho-Sarmatian ancestry

Saturday, November 4, 2023

Slavs have little, if any, Scytho-Sarmatian ancestry


Here's an abstract of a new study from the David Reich Lab about ancient Slavs, titled "Genetic identification of Slavs in Migration Period Europe using an IBD sharing graph". Emphasis is mine:

Popular methods of genetic analysis relying on allele frequencies such as PCA, ADMIXTURE and qpAdm are not suitable for distinguishing many populations that were important historical actors in the Migration Period Europe. For instance, differentiating Slavic, Germanic, and Celtic people is very difficult relying on these methods, but very helpful for archaeologists given a large proportion of graves with no inventory and frequent adoption of a different culture. To overcome these problems, we applied a method based on autosomal haplotypes. Imputation of missing genotypes and phasing was performed according to a protocol by Rubinacci et al. (2021), and IBD inference was done for ancient Eurasian individuals with data available at >600,000 1240K sites. IBD links for a subset of these individuals were represented as a graph, visualized with a force-directed layout algorithm, and clusters in this graph are inferred with the Leiden algorithm. One of the clusters in the IBD graph emerged that includes nearly all individuals in the dataset annotated archaeologically as “Slavic”. According to PCA a hypothesis for the origin of this population can be proposed: it was formed by admixture of a Baltic-related group with East Germanic people and Sarmatians or Scythians. The individuals belonging to the “Slavic” IBD sharing cluster form a chronological gradient on the PCA plot, with the earliest samples close to the Baltic LBA/EIA group. Later “Slavic” individuals are shifted to the right, closer to Central and Southern Europeans and probably reflecting further admixture of Slavs with local populations during the Migration Period.

Apparently this abstract is causing a bit of confusion online because of the mention of possible Sarmatian or Scythian ancestry in Slavs.

However, it's important to understand that the authors are referring to certain Slavic or even just Slavic-related individuals, usually from culturally heterogeneous frontier settlements deep in what is now Russia.

So yes, it's possible that some of these individuals carry Sarmatian, Scythian or other exotic eastern ancestry. But even if this is true, then obviously we can't extend this inference to all ancient and modern-day Slavs.

Indeed, below is a G25/Vahaduo Principal Component Analysis (PCA) that shows why modern-day Slavic speakers can't be linked genetically to Sarmatians or Scythians. To experience a more detailed version of the PCA paste the data here into the relevant field here.

As you can see, dear reader, most of the Slavs (Belarusians, Poles, Ukrainians and many Russians) cluster with the Irish near the western end of the plot.

Some Russians are shifted significantly east of them along the "Uralic cline" and, as a result, they cluster with various Uralic speakers such as Mordovians. That's because when Slavs migrated deep into what is now northern Russia they mixed with Uralic speakers who were there before them.

Most of the Sarmatians and Scythians form a cluster southeast of the Slavs and Irish because they carry significant levels of East Asian ancestry. This type of eastern ancestry is basically missing in modern-day Slavs (see here).

Several of the Scythians cluster among the Slavs and Irish, but that's because they're genetic outliers, whose existence, if anything, suggests that some Scythians had significant Slavic-related and/or Irish-related ancestry.

Now, even though most of the Slavs do cluster with the Irish in the above PCA plot, I strongly disagree with the authors of the abstract when they claim that "differentiating Slavic, Germanic, and Celtic people is very difficult" with PCA. It's actually pretty damn easy and I've been doing it successfully for many years. For instance, see here.

See also...

Wielbark Goths were overwhelmingly of Scandinavian origin

The Caucasus is a semipermeable barrier to gene flow

Sunday, January 23, 2022

Para-Turbo-Balto-Slavic?


I'm seeing increasing numbers of Bronze and Iron Age samples from Central Europe and surrounds with this peculiar set of traits:

- shared genetic drift with present-day Balto-Slavic speakers to the exclusion of most other Europeans

- and yet, an unusually low level of Yamnaya-related steppe ancestry

- so much so, in fact, that they're often outside the range of modern European genetic variation.

As far as I can tell, currently the best examples of this unusual population are HUN_Mako_EBA_o:I1502 (Mathieson et al. Nature 2015) and HUN_EIA_Prescythian_Mezocsat_o1:I18241 (Patterson et al. Nature 2021). Both are from the Carpathian Basin in what is now Hungary.

I ran a series of qpAdm mixture models to try and learn more about their origins. The most robust outcomes, out of about 50 different attempts, are these:

right pops:
CMR_Shum_Laka_8000BP
MAR_Taforalt
IRN_Ganj_Dareh_N
Levant_PPNB
TUR_Barcin_N
Iberia_Southeast_Meso
UKR_Meso
England_Meso
RUS_Karelia_HG
RUS_West_Siberia_HG
MNG_North_N
TWN_Hanben
BRA_LapaDoSanto_9600BP

HUN_Mako_EBA_o
Baltic_LTU_Narva 0.149 ∓0.028
POL_Globular_Amphora 0.613 ∓0.028
Yamnaya_RUS_Samara 0.238 ∓0.029
chisq 10.836
tail prob 0.370463
Full output

HUN_EIA_Prescythian_Mezocsat_o1
Baltic_LTU_Narva 0.186 ∓0.028
POL_Globular_Amphora 0.592 ∓0.027
Yamnaya_RUS_Samara 0.222 ∓0.029
chisq 12.492
tail prob 0.253499
Full output

Combining the two genomes produces a very similar result:

HUN_EBA-EIA_o
Baltic_LTU_Narva 0.160 ∓0.023
POL_Globular_Amphora 0.612 ∓0.023
Yamnaya_RUS_Samara 0.227 ∓0.023
chisq 14.653
tail prob 0.14524
Full output

Importantly, when I move RUS_Karelia_HG from the right pops to the left pops, to test whether HUN_EBA-EIA_o really has steppe ancestry, as opposed to closely related hunter-gatherer ancestry, I still get a very similar outcome:

HUN_EBA-EIA_o
Baltic_LTU_Narva 0.158 ∓0.027
POL_Globular_Amphora 0.605 ∓0.033
RUS_Karelia_HG 0.014 ∓0.038
Yamnaya_RUS_Samara 0.223 ∓0.053
chisq 10.461
tail prob 0.234171
Full output

So these largely Globular Amphora-related individuals do harbor as much as a quarter of steppe ancestry, which is to be expected considering the massive genetic turn-over that most of Europe experienced just before their time as a result of population expansions from the Pontic-Caspian steppe.

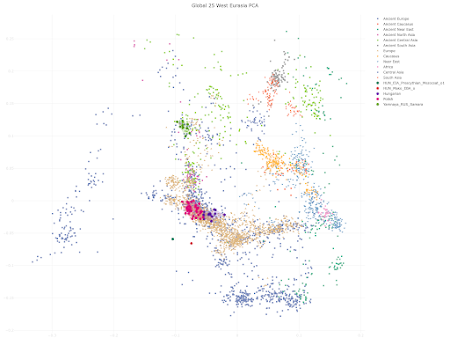
Nevertheless, this is ~20% less steppe ancestry than in the present-day populations of the region, and it clearly shows in any decent Principal Component Analysis (PCA) of West Eurasia. For instance:
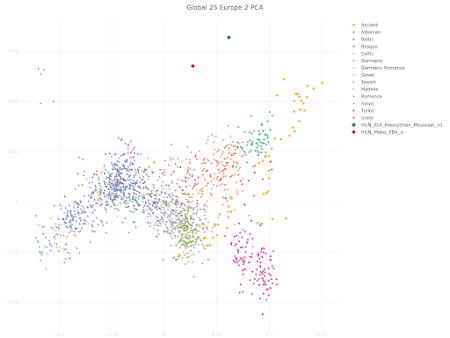
At the same time, the relatively close genetic relationship between these ancients and present-day Balto-Slavic speaking populations shows up in fine-scale intra-European PCA.

The origins and implications of this population are still a mystery to me. I don't think it's native to the Carpathian Basin. Indeed, my qpAdm models suggest that it may have moved into this region from somewhere to the northeast, because its ancestry is best modeled with ancient groups from present-day Lithuania, Poland and Russia.

I'm adamant that these people weren't Balto-Slavic speakers, and certainly not proto-Slavs. Rather, I suspect that much like the Welzin warriors of Bronze Age North-Central Europe, they were closely related to a contemporaneous group that eventually gave rise to proto-Slavs. At best, they may have somehow contributed to the ethnogenesis of Balto-Slavs.

By the way, using the Global25 to model their ancestry is highly problematic, because of the strong Balto-Slavic genetic drift that affects some of the dimensions. So be careful when you try it, or better yet, don't try it at all, and stick to formal stats in this particular instance.

See also...

Tollense Valley Bronze Age warriors were very close relatives of modern-day Slavs

Tuesday, January 11, 2022

Population genetics is a state of mind


Years of blogging about population genetics has seriously eroded my faith in the peer review process.

During the past decade I've witnessed an inordinate amount of crap published in basically all of the major science journals. Often the work is misguided in some way, sometimes even quite strange, and occasionally outright wrong.

Back in 2014, a team of scientists from the UK published a paper in Science emphatically titled A Genetic Atlas of Human Admixture History. These people were Garrett Hellenthal, George B. J. Busby, Gavin Band, James F. Wilson, Cristian Capelli, Daniel Falush, and Simon Myers. See here.

The thing that really sticks out for me in this paper is Figure 3, which shows the present-day Polish population as largely a mixture between Northern European- and Turkish-related ancestries. Incredibly, the Turkish-related ratio appears to be about 25% and dated to 438 CE.

This is not just inexplicable, but utterly wrong. It's a result that is impossible to reproduce with any standard population genetics methods.

In fact, in terms of deep ancient ancestry, present-day Poles are very similar to present-day Scandinavians, and even to Viking Age, Iron Age and Bronze Age Scandinavians. This is easy to demonstrate, for instance, with f4-statistics, in part based on samples from the Hellenthal et al. paper.

Chimp Yamnaya_Samara Swedish_modern Polish_modern -0.000311 -1.574
Chimp Yamnaya_Samara Ollsjo_Bronze_Age Polish_modern -0.000044 -0.152
Chimp Yamnaya_Samara Sealand_Iron_Age Polish_modern -0.000072 -0.293
Chimp Yamnaya_Samara Sealand_Viking_Age Polish_modern 0.000078 0.525
Chimp Yamnaya_Samara Gotland_Viking_Age Polish_modern -0.000141 -1.322

Chimp Barcin_N Swedish_modern Polish_modern -0.000318 -1.662
Chimp Barcin_N Ollsjo_Bronze_Age Polish_modern 0.000216 0.798
Chimp Barcin_N Sealand_Iron_Age Polish_modern -0.000023 -0.104
Chimp Barcin_N Sealand_Viking_Age Polish_modern -0.000186 -1.310
Chimp Barcin_N Gotland_Viking_Age Polish_modern 0.000083 0.788

Chimp Karelia_HG Swedish_modern Polish_modern -0.000134 -0.540
Chimp Karelia_HG Ollsjo_Bronze_Age Polish_modern 0.000056 0.162
Chimp Karelia_HG Sealand_Iron_Age Polish_modern 0.000047 0.153
Chimp Karelia_HG Sealand_Viking_Age Polish_modern 0.000424 2.241
Chimp Karelia_HG Gotland_Viking_Age Polish_modern 0.000134 0.959

Simply put, if Poles have ~25% ancestry from a Turkish-related source, then so do Swedes, Norwegians and basically all other Northern Europeans going back hundreds and even thousands of years. This is obviously not the case, and it's also not what Hellenthal et al. claimed anyway.

A year later, a team of scientists that again included Garrett Hellenthal, George B. J. Busby, James F. Wilson, Cristian Capelli and Simon Myers, published another, similar paper in Current Biology. And guess what? This paper also claimed that present-day Poles had Turkish-related ancestry, but this time dating to a somewhat later period. See Busby et al. 2015 Figure 4.C here.

I've got most of the samples from that paper, so I can analyze them myself, and I think I know what the problem is. Basically, the Turks are mixed. So what appears to have happened is that Busby et al. got things backwards.

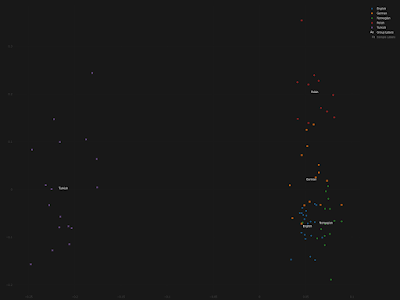
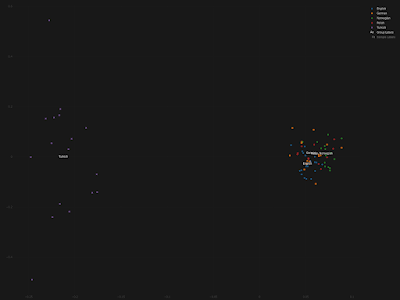
Below are three plots from a Principal Component Analysis (PCA) largely based on data from Busby et al., featuring samples from England, Germany, Norway, Poland and Turkey. The first plot is based on dimensions 1 and 2, the second plot on dimensions 1 and 3, and the third plot on dimensions 1 and 4. The relevant data file is available here.

Note that the Europeans are more or less symmetrically related to the Turks, which means none of these European populations has significantly more Turkish-related ancestry than the others. Indeed, it's the Turks who show more variation in the first (horizontal) dimension, suggesting that they might have variable levels of European ancestry.


I chose the aforementioned papers to make my point here because they made quite an impression on me. In other words, they really pissed me off.

For the sake of completeness, I'm now going to try and get in touch with the authors and ask them how on earth they managed to make these Poles Turkish-related, and also why they never corrected their mistake.

See also...

Don't believe everything you read in peer reviewed papers

Wednesday, August 19, 2020

Yamnaya-related ancestry proportions in present-day Poles


Modeling ancient ancestry proportions in present-day Europeans with the qpAdm software is now a lot more difficult. The reasons for this are updates to qpAdm as well as the availabiity of more useuful outgroups or right pops.

This isn't necessarily a bad thing, because users are forced to work harder to find successful models, which is likely to lead to some interesting discoveries. But it can be very frustrating.

I don't think that settling for poor statistical fits or using a small number of outrgoups are acceptable short cuts. Perhaps sequencing modern-day samples in exactly the same way as the ancient samples, and thus increasing the compatability between them, might help?

Limiting qpAdm runs to higher quality SNPs from transversion sites does help, but perhaps largely because of the significant reduction in markers?

In any case, I've now given up on running such analyses, at least until I see some serious pointers on the topic from Harvard's qpAdm experts. But before I put this project to bed for the time being, I'd like to share some new results for Poles from eastern and western Poland, respectively.

right pops:

CMR_Shum_Laka_8000BP
MAR_Taforalt
IRN_Ganj_Dareh_N
Levant_PPNB
GEO_CHG
TUR_Barcin_N
RUS_Piedmont_En
SRB_Iron_Gates_HG
WHG
RUS_Karelia_HG
MNG_North_N
RUS_Ust_Kyakhta

left pops:

Polish_East
CWC_Baltic_early 0.572±0.024
SWE_TRB 0.428±0.024
chisq 11.776
tail prob 0.300296
Full output

Polish_West
CWC_Baltic_early 0.587±0.021
SWE_TRB 0.413±0.021
chisq 11.165
tail prob 0.34478
Full output


Even using transversion sites, this is one of the very few combinations of ancient reference samples that works for the Poles with these right pops. That is, the combination of early Corded Ware samples from the East Baltic (CWC_Baltic_early) and Funnel Beaker samples from Scandinavia (SWE_TRB). The former are obviously the proxy here for Yamnaya-related ancestry.

Adding any sort of hunter-gatherer population to this model doesn't help or even makes things worse (for instance, see here and here). It is possible to add Baltic hunter-gatherers to a similar model after dropping CWC_Baltic_early in favor of closely related samples from the Early to Middle Bronze Age Pontic-Caspian steppe. Note, however, that the statistical fits are somewhat poorer.

Polish_East
Baltic_LTU_Narva 0.032±0.014
PC_steppe_EMBA 0.483±0.019
SWE_TRB 0.485±0.019
chisq 17.143
tail prob 0.0465198
Full output

Polish_West
Baltic_LTU_Narva 0.031±0.011
PC_steppe_EMBA 0.491±0.015
SWE_TRB 0.477±0.016
chisq 22.444
tail prob 0.00757421
Full output


Interestingly, but not surprisingly, the ancestry of many present-day Northwestern European populations can be modeled in basically the same way. That's because ancient ancestry proportions are more closely correlated with latitude than longitude across much of the European continent.

English_Kent
CWC_Baltic_early 0.527±0.024
SWE_TRB 0.473±0.024
chisq 13.042
tail prob 0.221357
Full output

Icelandic
CWC_Baltic_early 0.586±0.023
SWE_TRB 0.414±0.023
chisq 16.517
tail prob 0.085751
Full output

Scottish
CWC_Baltic_early 0.583±0.021
SWE_TRB 0.417±0.021
chisq 12.144
tail prob 0.275536
Full output


A zip file with the qpAdm output from this analysis and a list of the most relevant ancients is available here. I might try to run a few more populations over the next few days, but probably only from the northern half of Europe, so please check the zip file in a week or so to see what else is in there.

If anyone wants to challenge my results, note that these and very similar samples are freely available to the public via Harvard University here and here.

Update 22/08/2020: From Nick Patterson (Broad) in the comments:
My general advice for qpAdm is 1) Work on the right hand set. Don't include irrelevant population (except for one population as an outgroup); picking the best RHS can dramatically reduce s. errors on the admixture weights. 2) If qpAdm gives a very low p-value try and understand why, sometimes it is telling you that the target is not a mixture of the sources but sometimes the assumptions are violated, for example recent gene-flow from left pops -> right.

See also...

Ancient ancestry proportions in present-day Europeans

Monday, July 27, 2020

Ancient ancestry proportions in present-day Europeans (to be continued)


This year has already been massive in all sorts of ways, including for new data and software releases. So I'm thinking it might be time to update many of the analyses that were featured at this blog a while ago.

Let's start with the classic hunter vs farmer vs herder mixture model for present-day European populations. The rules of the game are as follows:


- run the latest version of qpAdm using qpfstats output

- use transversion sites and 1240K capture data

- pick a set of diverse and chronologically sound outgroups

- for a model to be successful the p-value must reach 0.01

- tweak the left pops in models that are clearly underperforming

- follow high end scientific literature, logic and common sense


Obviously, the reason that I decided to limit my analysis to markers from transversion sites is to mitigate problems associated with modeling the ancestry of modern, high quality samples with relatively low quality ancients. One of these problems appears to be qpAdm assigning faux East Asian/Siberian admixture to present-day Europeans (for instance, see figure 4 here).

My starting reference populations and outgroups are listed below. In qpAdm terminology the former are known as the "left pops", while the latter as the "right pops". Most of these samples are freely available at the David Reich Lab website here.

left pops:
HUN_Koros_N_HG
TUR_Barcin_N
UKR_Yamnaya

right pops:
CMR_Shum_Laka_8000BP
MAR_Taforalt
Levant_Natufian
IRN_Ganj_Dareh_N
Levant_PPNB
CZE_Vestonice16
BEL_GoyetQ116-1
Iberia_ElMiron
RUS_Karelia_HG
RUS_West_Siberia_HG
MNG_North_N
RUS_Ust_Kyakhta

As you can see, I picked a wide variety of right pops. But I chose most of them specifically to be able to differentiate the three streams of ancestry - from ancient hunters, farmers and herders - that are the focus of my analysis. I also intentionally avoided using samples in the right pops that may have experienced gene flow, including cryptic gene flow, from the populations in the left pops.

I somewhat speculatively earmarked HUN_Koros_N_HG, from the Early Neolithic Carpathian Basin, and UKR_Yamnaya, from the Early Bronze Age North Pontic steppe in what is now Ukraine, to represent the hunter-gatherer and pastoralist streams of ancestry, respectively.

That's because I expected HUN_Koros_N_HG to be the best proxy for the hunter-gatherer ancestry that was initially absorbed by the early farmers who fanned out from the Aegean region across much of the European continent, and of course it made sense to choose a steppe pastoralist population that was located close to Central Europe where such groups first made the biggest impact outside of the steppe.

Interestingly, HUN_Koros_N_HG and UKR_Yamnaya did prove to be among most effective choices for the types of ancestries that they represented. For instance, UKR_Yamnaya generally produced much stronger statistical fits than a very similar set of Yamnaya samples from the Caspian steppe (more precisely, from the Samara region in Russia). However, this might well be an artifact, due to very specific characteristics of these few ancient individuals. Larger sample sets would be welcome, especially from Yamnaya sites in Ukraine.

Below, dear audience, is a spreadsheet featuring the preliminary results. Click on the image to view and/or download the spreadsheet. The general rule is that the higher the tail prob, or p-value, the more likely it is that the ancestry proportions are close to the truth (a tail prob of well below 0.05 is usually a strong indication that something isn't right). For a detailed look at each of the qpAdm runs, feel free to consult the zip file here.


Note, however, that many of the European groups in my burgeoning genotype dataset are yet to make an appearance in the spreadsheet. That's because their models with the standard left pops showed p-values well under 0.01, which essentially meant that they failed, and I'm still trying to make them work.

But round one has certainly revealed some fascinating stuff. For instance, except for Hungarians and Estonians, none of the Uralic-speaking groups can be modeled successfully in the standard three-way model.

However, I managed to significantly improve the statistical fits in their models by adding a Siberian population, RUS_Baikal_BA, to the left pops. This is unlikely to be a coincidence, because the Proto-Uralic homeland was almost certainly located in or very near Siberia. Iain Mathieson please take note.

Saami
HUN_Koros_N_HG 0.134±0.043
RUS_Baikal_BA 0.270±0.015
TUR_Barcin_N 0.081±0.026
UKR_Yamnaya 0.515±0.058
chisq 19.865
tail prob 0.0108571

See also...