search this blog

Showing posts with label Balts. Show all posts

Friday, November 10, 2023

Wielbark Goths were overwhelmingly of Scandinavian origin


When used properly, Principal Component Analysis (PCA) is an extraordinarily powerful tool and one of the best ways to study fine-scale genetic substructures within Europe.

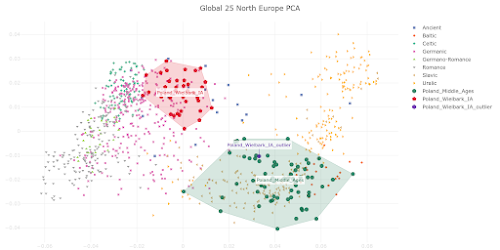
The PCA plot below is based on Global25 data and focuses on the genetic relationship between Wielbark Goths and Medieval Poles, including from the Viking Age, in the context of present-day European genetic variation.


I'd say that it's a wonderfully self-explanatory plot, but here are some key observations:

- the Wielbark Goths (Poland_Wielbark_IA) and Medieval Poles (Poland_Middle_Ages) are two distinct populations

- moreover, the Wielbark Goths form a relatively compact Scandinavian-related cluster and must surely represent a homogenous population overwhelmingly of Scandinavian origin

- on the other hand, the Medieval Poles form a more extensive and heterogeneous cluster that overlaps with present-day groups all the way from Central Europe to the East Baltic, and that's because they are likely to be in large part of mixed origin

- I know for a fact that at least some of these early Poles harbor recent admixture, because their burials are similar to those of Vikings and their haplotypes have been shown to be partly of Scandinavian origin (see here)

- one of the Wielbark females is an obvious genetic outlier (Poland_Wielbark_IA_outlier), and basically looks like a first generation mixture between a Goth and a Balt.

Please note that the PCA is only based on relatively high quality genomes, so as not to confuse the picture with spurious results and noise. Also, all outliers with potentially significant ancestry from outside of Central, Eastern and Northern Europe were removed from the analysis. The relevant datasheet is available here.

However, sanity checks are always important when studying complex topics like fine-scale genetic ancestry. To that end I've prepared a graph based on f3-statistics of the form f3(X,Cameroon_SMA,Estonia_BA)/(X,Cameroon_SMA,Ireland_Megalithic), that reproduces the key features of my PCA. The relevant datasheet is available here.

Polish groups from the Middle Ages are marked with the MA suffix, while the Iron Age Wielbark Goths are marked with the IA suffix.

If you're wondering why I plotted the f3-statistics that I did, take a look at this (all groups largely of Scandinavian origin are emboldened):

f3(X,Estonia_BA,Cameroon_SMA)
Poland_Legowo_MA 0.226406
Poland_Ostrow_Lednicki_MA 0.225996
Poland_Plonsk_MA 0.225017
Poland_Trzciniec_Culture 0.224215
Poland_Lad_MA 0.224142
Poland_Viking 0.223838
Poland_Niemcza_MA 0.223659
Poland_Weklice_IA 0.223549
Poland_Kowalewko_IA 0.222584
Poland_Pruszcz_Gdanski_IA 0.222324
Sweden_Viking 0.222091
Russia_Viking 0.222042
Poland_Maslomecz_IA 0.221914
Norway_Viking 0.221825
Denmark_EarlyViking 0.221257
Denmark_Viking 0.221174
England_Viking 0.220979

f3(X,Ireland_Megalithic,Cameroon_SMA)
Poland_Maslomecz_IA 0.219816
Poland_Weklice_IA 0.219501
Denmark_Viking 0.2192
Poland_Kowalewko_IA 0.219176
Poland_Ostrow_Lednicki_MA 0.218916
Norway_Viking 0.218854
Poland_Pruszcz_Gdanski_IA 0.218684
Sweden_Viking 0.218626
Denmark_EarlyViking 0.218529
England_Viking 0.218308
Russia_Viking 0.217999
Poland_Viking 0.217914
Poland_Plonsk_MA 0.217756
Poland_Lad_MA 0.217719
Poland_Legowo_MA 0.21765
Poland_Niemcza_MA 0.217001
Poland_Trzciniec_Culture 0.216551

Interestingly, the Middle Bronze Age samples associated with the Trzciniec Culture (Poland_Trzciniec_Culture) show a closer genetic relationship to Medieval Poles than to Wielbark Goths or Northwestern Europeans. This is indeed the case both in terms of genome-wide and uniparental markers, including some very specific lineages under Y-chromosome haplogroup R1a.

But that's a much more complex issue that I'll leave for another time. So please stay tuned.

See also...

Slavs have little, if any, Scytho-Sarmatian ancestry

Thursday, June 17, 2021

Balto-Slavic drift


A few years ago I began using the term "Balto-Slavic genetic drift" to describe the fine-scale genetic signal that is shared by the speakers of Baltic and Slavic languages to the exclusion of Europeans without significant Balto-Slavic ancestry.

As a result, nowadays, many people online use the term "Balto-Slavic drift" when referring to this phenomenon.

The easiest way to prove that Balto-Slavic drift exists is to run a fine-scale Principal Component Analysis (PCA) of European genetic variation with a lot of Balto-Slavic samples in the mix. Indeed, my Global25 PCA analysis does a great job of illustrating the impact of Balto-Slavic drift on the population structure of Europe both in PCA plots and mixture models (for instance, see here).

It's also possible to tease out Balto-Slavic drift with formal statistics. I showed this indirectly in a recent blog post about Greek population structure (see here). In this post I'm going to demonstrate how to explicitly and formally test for Balto-Slavic drift both in ancient and present-day samples.

To do this we need to find stats that basically split Baltic and Slavic speakers from other Europeans, such as f4(Outgroup,Test;Bell_Beaker_NDL,Baltic_LVA_BA). In this f4-stat, Baltic_LVA_BA is the ancient reference population with an unusually high level of Balto-Slavic drift, while Bell_Beaker_NDL is a fairly similar population overall in terms of ancient ancestry components, but with practically zero Balto-Slavic drift.

Note that the statistics with the most significant Z scores (>3) involve populations that speak Baltic or Slavic languages, or their neighbors who plausibly harbor significant Baltic and/or Slavic ancestry. Among the ancient, mostly Scandinavian, populations (from Margaryan et al. 2020 and marked with the VK2020 prefix), significant Balto-Slavic drift only appears in the more easterly and/or later groups from the Viking Age (VA).


Unfortunately, one of the problems with this analysis is that Baltic_LVA_BA and Bell_Beaker_NDL aren't identical in terms of their ancient ancestry proportions. For one, the latter has significantly more Neolithic farmer ancestry. No wonder then, that Greeks, who are mostly of early farmer stock, don't show a significant Z score, despite probably packing a significant amount of Balto-Slavic ancestry dating to the Middle Ages.

In the near future, as more ancient samples become available, it might be possible to find better reference populations for the job and create more accurate, finer-scaled tests.

See also...

Uralian genes

That old chestnut: Northeast vs Northwest Euros

Sunday, January 17, 2021

That old chestnut: Northeast vs Northwest Euros


In the last comment thread reader Greg put forth this question:

David, when are you going to explain the genetic discrepancy between Northeastern and Northwestern Europeans? You know, the one that people believe is due to Baltic Hunter-Gatherer admixture, whereas you believe it is due to genetic drift? You ought to make a post about this issue at some point, because a lot of people are wondering what's causing the differences.

Well, Greg, this issue has been discussed to the proverbial death here and elsewhere. In fact, there were two posts and rather lengthy comment threads on the same topic at this blog just a few months ago. See here and here.

Nevertheless, it seems that a fair number of people are still befuddled, so I'm going to try to explain this one last time, as briefly as a I can using just a handful of f4-stats.

Admittedly, Northeast Europeans generally do pack higher levels of indigenous European hunter-gatherer ancestry than Northwest Europeans. This is especially true of Balts, who show more of this type of ancestry than even Scandinavians in practically every type of analysis.

The f4-stats below back this up unambiguously. Note the significantly positive (>3) Z scores, which suggest that Latvians and Lithuanians harbor more Baltic hunter-gatherer-related ancestry than Norwegians and Swedes.

Chimp Baltic_HG Norwegian Latvian 0.001301 7.114
Chimp Baltic_HG Swedish Latvian 0.001017 4.205
Chimp Baltic_HG Norwegian Lithuanian 0.001023 7.341
Chimp Baltic_HG Swedish Lithuanian 0.000763 3.408

Greg, I know what you're thinking: the naysayers are right! But wait, because there's a twist to this tale. Check out these f4-stats:

Chimp Baltic_HG Norwegian Belarusian 0.000265 1.934
Chimp Baltic_HG Swedish Belarusian 0.000152 0.7
Chimp Baltic_HG Norwegian Polish 6.4E-05 0.519
Chimp Baltic_HG Swedish Polish -0.000235 -1.074

Please note, Greg, that none of the Z scores reach significance, which means that these Northwest Europeans and Slavs are symmetrically related to Baltic_HG. They're also symmetrically related to other relevant ancient groups such as the Yamnaya steppe herders. This, of course, suggests that they harbor very similar levels of basically the same ancient genetic components.

Chimp Karelia_HG Norwegian Belarusian 0.000136 0.844
Chimp Karelia_HG Swedish Belarusian 7.9E-05 0.32
Chimp Karelia_HG Norwegian Polish -4.7E-05 -0.304
Chimp Karelia_HG Swedish Polish -0.000134 -0.54

Chimp Yamnaya_Samara Norwegian Belarusian -0.000134 -1.085
Chimp Yamnaya_Samara Swedish Belarusian -6.6E-05 -0.34
Chimp Yamnaya_Samara Norwegian Polish -0.000225 -1.995
Chimp Yamnaya_Samara Swedish Polish -0.000311 -1.574

Chimp Barcin_N Norwegian Belarusian -0.000335 -2.809
Chimp Barcin_N Swedish Belarusian -0.000284 -1.491
Chimp Barcin_N Norwegian Polish -0.000222 -2.057
Chimp Barcin_N Swedish Polish -0.000318 -1.662

Chimp Baikal_N Norwegian Belarusian 0.000186 1.3
Chimp Baikal_N Swedish Belarusian -7E-05 -0.33
Chimp Baikal_N Norwegian Polish -4.6E-05 -0.351
Chimp Baikal_N Swedish Polish -0.000477 -2.277

Interestingly, pairing up Ukrainians with English samples from Cornwall and Kent produces similar outcomes. But that's because most ancient ancestry proportions in Europe show a closer correlation with latitude than longitude.

Chimp Baltic_HG English_Cornwall Ukrainian 0.000282 2.242
Chimp Baltic_HG English_Kent Ukrainian 0.000225 1.748

Chimp Karelia_HG English_Cornwall Ukrainian 0.000323 2.175
Chimp Karelia_HG English_Kent Ukrainian 0.000239 1.634

Chimp Yamnaya_Samara English_Cornwall Ukrainian -6.6E-05 -0.569
Chimp Yamnaya_Samara English_Kent Ukrainian -0.000112 -0.977

Chimp Barcin_N English_Cornwall Ukrainian -0.000519 -4.641
Chimp Barcin_N English_Kent Ukrainian -0.000598 -5.232

Chimp Baikal_N English_Cornwall Ukrainian 0.000385 2.874
Chimp Baikal_N English_Kent Ukrainian 0.00036 2.836

Now, Greg, if at least in terms of genetic ancestry, Latvians, Lithuanians, Belarusians, Poles and Ukrainians all qualify as Northeast Europeans, then what makes them different, as a group, from Northwest Europeans? Do you believe that the key factor is admixture from Baltic hunter-gatherers? Or is it genetic drift?

Of course, considering all of the f4-stats above, logic dictates that it must be relatively recent genetic drift.

Keep in mind, however, that this only applies to Balto-Slavic speaking Northeast Europeans without significant Uralian ancestry. Overall, Uralic speakers have a more complex population history, and indeed genetic differences between them and Northwest Europeans are in large part due to somewhat different ancestry proportions and also Siberian admixture.

See also...

So who's the most (indigenous) European of us all?
Friday, November 13, 2020

Fatyanovo as part of the wider Corded Ware family (Nordqvist and Heyd 2020)


There's a new archeological paper about the Fatyanovo culture at the Proceedings of the Prehistoric Society [LINK]. It includes this quote on page 18:

In the traditional narrative, the Fatyanovo people – like the CWC populations in general – are regarded as Indo-European, representing the pre-Balto-Slavic (-Germanic) stage (Carpelan & Parpola 2001, 88; Anthony 2007, 380; also Gimbutas 1956, 163; Tretyakov 1966, 109) in the spread of Indo-European languages.

That's correct, but considering the latest ancient DNA research on the Fatyanovo people, the traditional narrative is probably wrong. Fatyanovo males were rich in Y-haplogroup R1a-Z93, which is found at very low frequencies in Balto-Slavic populations (see here). It's actually much more common nowadays in Central and South Asia, where it often reaches frequencies of over 50% in Indo-Iranian speaking groups.

Balts and Slavs are rich in R1a-Z282, which is a sister clade of R1a-Z93 that has been found in Corded Ware and Corded Ware-related samples from west of Fatyanovo sites. That is, in present-day Poland and the Baltic states.

Therefore, the origins of the Balto-Slavs should be sought somewhere west of the Fatyanovo culture, probably in the Corded Ware derived populations from what is now the border zone between Poland, Belarus and Ukraine.

Indeed, in my view the Fatyanovo people are more likely to have spoken Proto-Indo-Iranian rather than anything ancestral to Baltic or Slavic (see here).
Nordqvist and Heyd, The Forgotten Child of the Wider Corded Ware Family: Russian Fatyanovo Culture in Context, Proceedings of the Prehistoric Society, online 12 November 2020, DOI: https://doi.org/10.1017/ppr.2020.9

See also...

The oldest R1a to date

Saturday, May 11, 2019

Uralic-specific genome-wide ancestry did make a signifcant impact in the East Baltic


I've started analyzing the ancient genotype data from the recent Saag et al. paper on the expansion of Uralic languages and associated spread of Siberian ancestry into the East Baltic region. The paper is freely available here and the data are here.

I really like the paper, but I don't agree with the authors' claim that the appearance of Y-chromosome haplogroup N in what is now Estonia and surrounds during the Iron Age is "not matched by a clear shift in autosomal profiles". In my opinion it certainly is, and, as one would expect, it's a shift towards a genetic profile typical of western Uralic speakers.

I'd say that the easiest way to find this signal is with a Principal Component Analysis (PCA) focusing on fine scale genetic substructures within Northern Europe, like the one below. The relevant datasheet is available here.


Note that the East Baltic Iron Age samples, all from burial sites in what is now Estonia, appear to be peeling away from their Bronze Age predecessors and overlapping strongly with present-day Estonians, who are Uralic speakers. Indeed, the PCA suggests to me that the formation of the greater part of the present-day Estonian gene pool took place in the East Baltic during the transition from the Bronze Age to the Iron Age. That is, when Uralic languages are generally accepted to have arrived in the region from near the Ural Mountains in the east.

I was also able to closely replicate these outcomes with my Global25 data using the method described here. However, in this effort, present-day Estonians are clearly more western than the Estonian Iron Age samples (EST_IA), which might be due to the presence of low level Germanic ancestry in Estonia dating to the medieval period. The relevant datasheet is available here.


Interestingly, the Estonian Bronze Age samples (EST_BA) come from stone-cist graves which are widely hypothesized to have been introduced to the East Baltic from the Nordic Bronze Age civilization. I even recall reading a paper on the topic which claimed that the remains buried in such graves were those of Proto-Germanic-speaking Scandinavian migrants. Well, I haven't had a chance to study these samples in any great detail yet, but considering that in both of the PCA above they're overlapping strongly with Latvian Bronze Age samples (LVA_BA) and sitting far away from the nearest Scandinavians, I'd say they're probably of local stock from way back.

See also...

It was always going to be this way

On the association between Uralic expansions and Y-haplogroup N

Inferring the linguistic affinity of long dead and non-literate peoples: a multidisciplinary approach

Thursday, May 9, 2019

It was always going to be this way


The native peoples of the East Baltic - Estonians, Latvians and Lithuanians - are genetically alike and their paternal gene pools are dominated by the same two Y-chromosome haplogroups: R1a and N3a.

Linguistically, however, Estonians are a world apart from Latvians and Lithuanians. That's because the Estonian language belongs to the Uralic language family, which has an obvious North Eurasian character. On the other hand, Latvian and Lithuanian are both classified as Indo-European languages, along with the vast majority of other European languages.

The Uralic and Indo-European language families may or may not descend from the same ancestral tongue, but even if they do, their relationship is very distant.

So how is it that Estonians came to speak a Uralic language? As far back as I can remember, the basic explanation accepted by most people was that Uralic speech arrived in what is now Estonia and neighboring Finland during the Bronze Age with migrants, or perhaps invaders, rich in N3a from somewhere around the Ural Mountains. Conversely, Latvians and Lithuanians were generally assumed to have retained the Indo-European speech of their R1a-rich forefathers from the Pontic-Caspian steppe, who colonized much of Eastern Europe north of the steppe during the Late Neolithic.

Ancient DNA has now uncannily corroborated these theories (for instance, see Mittnik et al. 2018 and, published today, Saag et al. 2019). All it took was a handful of samples from a few relevant sites. I think that's awesome; I love it when sensible, long-standing hypotheses are validated by cutting edge science.

I'll have a lot more to say about the spread of Uralic languages and Uralian genes to the East Baltic when I get my hands on the genotype data from the new Saag et al. paper. I also have a post coming soon about the Nordic Bronze Age. Stay tuned.


Update 10/05/2019: Uralic-specific genome-wide ancestry did make a signifcant impact in the East Baltic

See also...

Late PIE ground zero now obvious; location of PIE homeland still uncertain, but...

Corded Ware people =/= Proto-Uralics (Tambets et al. 2018)

Inferring the linguistic affinity of long dead and non-literate peoples: a multidisciplinary approach