


David, when are you going to explain the genetic discrepancy between Northeastern and Northwestern Europeans? You know, the one that people believe is due to Baltic Hunter-Gatherer admixture, whereas you believe it is due to genetic drift? You ought to make a post about this issue at some point, because a lot of people are wondering what's causing the differences.Well, Greg, this issue has been discussed to the proverbial death here and elsewhere. In fact, there were two posts and rather lengthy comment threads on the same topic at this blog just a few months ago. See here and here. Nevertheless, it seems that a fair number of people are still befuddled, so I'm going to try to explain this one last time, as briefly as a I can using just a handful of f4-stats. Admittedly, Northeast Europeans generally do pack higher levels of indigenous European hunter-gatherer ancestry than Northwest Europeans. This is especially true of Balts, who show more of this type of ancestry than even Scandinavians in practically every type of analysis. The f4-stats below back this up unambiguously. Note the significantly positive (>3) Z scores, which suggest that Latvians and Lithuanians harbor more Baltic hunter-gatherer-related ancestry than Norwegians and Swedes.
Chimp Baltic_HG Norwegian Latvian 0.001301 7.114 Chimp Baltic_HG Swedish Latvian 0.001017 4.205 Chimp Baltic_HG Norwegian Lithuanian 0.001023 7.341 Chimp Baltic_HG Swedish Lithuanian 0.000763 3.408Greg, I know what you're thinking: the naysayers are right! But wait, because there's a twist to this tale. Check out these f4-stats:
Chimp Baltic_HG Norwegian Belarusian 0.000265 1.934 Chimp Baltic_HG Swedish Belarusian 0.000152 0.7 Chimp Baltic_HG Norwegian Polish 6.4E-05 0.519 Chimp Baltic_HG Swedish Polish -0.000235 -1.074Please note, Greg, that none of the Z scores reach significance, which means that these Northwest Europeans and Slavs are symmetrically related to Baltic_HG. They're also symmetrically related to other relevant ancient groups such as the Yamnaya steppe herders. This, of course, suggests that they harbor very similar levels of basically the same ancient genetic components.
Chimp Karelia_HG Norwegian Belarusian 0.000136 0.844 Chimp Karelia_HG Swedish Belarusian 7.9E-05 0.32 Chimp Karelia_HG Norwegian Polish -4.7E-05 -0.304 Chimp Karelia_HG Swedish Polish -0.000134 -0.54 Chimp Yamnaya_Samara Norwegian Belarusian -0.000134 -1.085 Chimp Yamnaya_Samara Swedish Belarusian -6.6E-05 -0.34 Chimp Yamnaya_Samara Norwegian Polish -0.000225 -1.995 Chimp Yamnaya_Samara Swedish Polish -0.000311 -1.574 Chimp Barcin_N Norwegian Belarusian -0.000335 -2.809 Chimp Barcin_N Swedish Belarusian -0.000284 -1.491 Chimp Barcin_N Norwegian Polish -0.000222 -2.057 Chimp Barcin_N Swedish Polish -0.000318 -1.662 Chimp Baikal_N Norwegian Belarusian 0.000186 1.3 Chimp Baikal_N Swedish Belarusian -7E-05 -0.33 Chimp Baikal_N Norwegian Polish -4.6E-05 -0.351 Chimp Baikal_N Swedish Polish -0.000477 -2.277Interestingly, pairing up Ukrainians with English samples from Cornwall and Kent produces similar outcomes. But that's because most ancient ancestry proportions in Europe show a closer correlation with latitude than longitude.
Chimp Baltic_HG English_Cornwall Ukrainian 0.000282 2.242 Chimp Baltic_HG English_Kent Ukrainian 0.000225 1.748 Chimp Karelia_HG English_Cornwall Ukrainian 0.000323 2.175 Chimp Karelia_HG English_Kent Ukrainian 0.000239 1.634 Chimp Yamnaya_Samara English_Cornwall Ukrainian -6.6E-05 -0.569 Chimp Yamnaya_Samara English_Kent Ukrainian -0.000112 -0.977 Chimp Barcin_N English_Cornwall Ukrainian -0.000519 -4.641 Chimp Barcin_N English_Kent Ukrainian -0.000598 -5.232 Chimp Baikal_N English_Cornwall Ukrainian 0.000385 2.874 Chimp Baikal_N English_Kent Ukrainian 0.00036 2.836Now, Greg, if at least in terms of genetic ancestry, Latvians, Lithuanians, Belarusians, Poles and Ukrainians all qualify as Northeast Europeans, then what makes them different, as a group, from Northwest Europeans? Do you believe that the key factor is admixture from Baltic hunter-gatherers? Or is it genetic drift? Of course, considering all of the f4-stats above, logic dictates that it must be relatively recent genetic drift. Keep in mind, however, that this only applies to Balto-Slavic speaking Northeast Europeans without significant Uralian ancestry. Overall, Uralic speakers have a more complex population history, and indeed genetic differences between them and Northwest Europeans are in large part due to somewhat different ancestry proportions and also Siberian admixture. See also... So who's the most (indigenous) European of us all?
uqrmaie1.github.io/admixtoolsI don't have access to a Linux machine right now, but since this thing runs in R then it also runs in Windows, and I do have a Windows computer here. One of the most interesting and useful features in the new R package is arguably the find_graphs function, which automatically searches for admixture graphs that reflect the observed f-statistics. That is, once the user chooses the samples and settings, find_graphs runs an unsupervised admixture graph analysis. Here are a couple of graphs that I knocked out with find_graphs in about five minutes each. The commands and settings that I used are listed in a text file here.


- RUS_Progress-Vonyuchka_En harbors GEO_Kotias-Satsurblia_HG-related ancestry, not IRN_Ganj_Dareh_N-related ancestry - IRN_Ganj_Dareh_N and TKM_Geoksyur_En form a clade to the exclusion of GEO_Kotias-Satsurblia_HG.The results are certainly in line with those from other types of analyses that I've done on this blog (for instance, see here and here). Update 05/01/21: Robert Maier, one of the creators of Admixtools2, has left this message in the comments below.
I'm glad to see that there is so much interest in Admixtools2! I very much appreciate any comments and suggestions on how to improve it and how to make it more user friendly. Because it's still under active development, some things are likely to change in the future. For example, there is a faster successor to "find_graphs", called "find_graphs2", but in the future they will probably be merged into one. I'm in David Reich’s group at Harvard and Broad and we are hoping to publish a paper describing Admixtools2 where we illustrate its value by using it to test how robust several previously published results are by exploring a large number of alternative models for each of them. If any of you use Admixtools2 to find graphs that are significantly better fits than published graphs and are also historically plausible - or if you find families of graphs that are equally good fits to the published ones but provide qualitatively different conclusions about population relationships - please contact us. That would be a meaningful contribution to the paper we write about this and we’d be open to including someone as a co-author based on identifying case studies like this.
- the search for the Proto-Indo-European homeland will shift west to the North Pontic steppe - on the other hand, the search for the Proto-Uralic homeland will move deep into Siberia - the key role of the Single Grave (westernmost Corded Ware) culture in the population history of Western Europe will finally get some attention - following on from the above, Y-haplogroup R1b-L51 will be revealed as a Single Grave marker - the idea that the Pontic-Caspian steppe was colonized by migrants from Mesopotamia during the Bronze Age will be forgotten, and, ironically, we'll instead learn that there was a significant influx of steppe ancestry into ancient Mesopotamia - Old Kingdom Egyptians will come out less Sub-Saharan African than present-day Egyptians.I probably shouldn't blab everything out, so that's all you're getting from me for now. You'll just have to wait for the rest until next year, or perhaps even the year after that. See also...

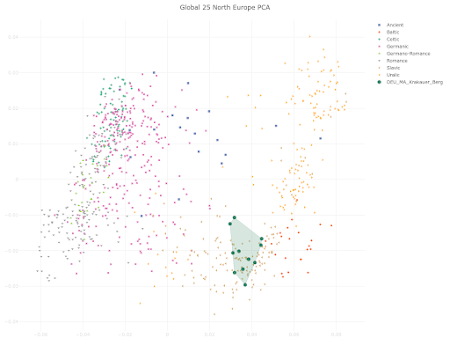


- this may have been a battle between two Central European armies, one rich in Y-haplogroup R1b and the other rich in Y-haplogroup I2a, as well as their allies or hired help, including warriors from Eastern Europe belonging to Y-haplogroup R1a - or perhaps it was an invasion from the east by warriors rich in Y-haplogroup R1a, and it was a success, with the local armies, rich in Y-haplogroups R1b and I2a, losing the battle and suffering most of the casualties.I'm sure that one day someone will attempt to undertake a decent multidisciplinary study of this epic battle, and we'll at least have a rough idea about what happened. Or not. Citation... Burger et al., Low Prevalence of Lactase Persistence in Bronze Age Europe Indicates Ongoing Strong Selection over the Last 3,000 Years, Current Biology, Available online 3 September 2020, https://doi.org/10.1016/j.cub.2020.08.033 See also... Genetic and linguistic structure across space and time in Northern Europe
right pops:CMR_Shum_Laka_8000BP
MAR_Taforalt
IRN_Ganj_Dareh_N
Levant_PPNB
GEO_CHG
TUR_Barcin_N
RUS_Piedmont_En
SRB_Iron_Gates_HG
WHG
RUS_Karelia_HG
MNG_North_N
RUS_Ust_Kyakhtaleft pops:Polish_East
CWC_Baltic_early 0.572±0.024
SWE_TRB 0.428±0.024
chisq 11.776
tail prob 0.300296
Full outputPolish_West
CWC_Baltic_early 0.587±0.021
SWE_TRB 0.413±0.021
chisq 11.165
tail prob 0.34478
Full output
Even using transversion sites, this is one of the very few combinations of ancient reference samples that works for the Poles with these right pops. That is, the combination of early Corded Ware samples from the East Baltic (CWC_Baltic_early) and Funnel Beaker samples from Scandinavia (SWE_TRB). The former are obviously the proxy here for Yamnaya-related ancestry. Adding any sort of hunter-gatherer population to this model doesn't help or even makes things worse (for instance, see here and here). It is possible to add Baltic hunter-gatherers to a similar model after dropping CWC_Baltic_early in favor of closely related samples from the Early to Middle Bronze Age Pontic-Caspian steppe. Note, however, that the statistical fits are somewhat poorer.
Interestingly, but not surprisingly, the ancestry of many present-day Northwestern European populations can be modeled in basically the same way. That's because ancient ancestry proportions are more closely correlated with latitude than longitude across much of the European continent.Polish_East
Baltic_LTU_Narva 0.032±0.014
PC_steppe_EMBA 0.483±0.019
SWE_TRB 0.485±0.019
chisq 17.143
tail prob 0.0465198
Full outputPolish_West
Baltic_LTU_Narva 0.031±0.011
PC_steppe_EMBA 0.491±0.015
SWE_TRB 0.477±0.016
chisq 22.444
tail prob 0.00757421
Full output
A zip file with the qpAdm output from this analysis and a list of the most relevant ancients is available here. I might try to run a few more populations over the next few days, but probably only from the northern half of Europe, so please check the zip file in a week or so to see what else is in there. If anyone wants to challenge my results, note that these and very similar samples are freely available to the public via Harvard University here and here. Update 22/08/2020: From Nick Patterson (Broad) in the comments:English_Kent
CWC_Baltic_early 0.527±0.024
SWE_TRB 0.473±0.024
chisq 13.042
tail prob 0.221357
Full outputIcelandic
CWC_Baltic_early 0.586±0.023
SWE_TRB 0.414±0.023
chisq 16.517
tail prob 0.085751
Full outputScottish
CWC_Baltic_early 0.583±0.021
SWE_TRB 0.417±0.021
chisq 12.144
tail prob 0.275536
Full output
My general advice for qpAdm is 1) Work on the right hand set. Don't include irrelevant population (except for one population as an outgroup); picking the best RHS can dramatically reduce s. errors on the admixture weights. 2) If qpAdm gives a very low p-value try and understand why, sometimes it is telling you that the target is not a mixture of the sources but sometimes the assumptions are violated, for example recent gene-flow from left pops -> right.See also... Ancient ancestry proportions in present-day Europeans


Hi everyone!
New tool - PCA 3D Viewer.
Global 25 version:
https://vahaduo.github.io/3d/g25
West Eurasia version:
https://vahaduo.github.io/3d/we
Usage:
Dots - ancients, circles - moderns.
Click X, Y, Z or COLOR tab and then click one of the PCx buttons to switch dimensions.
Click already active X, Y, Z or COLOR tab to temporarily reverse selected dimension. It will be restored to a default state when any of the dimensions will be switched to another one.
ADD CUSTOM POINTS - self-explanatory. Points will be added as "+". IMPORTANT - G25 version takes NON-SCALED coordinates. This will be true for any new tool dedicated to G25 and coordinates will be scaled automatically when needed or desired.
"Type parts of names." + TAG button - type parts of names to tag certain samples (try for example "KK1 Afon Pinar"). Search is Case Sensitive. Points will be redrawn as "x".
Next row - Labels and Annotations. Click the right button to cycle trough:
CLEAR LABELS + LABELS:AUTO
CLEAR ANNOTATIONS + ANNOTATIONS:CLICK
CLEAR ANNOTATIONS + ANNOTATIONS:AUTO
CLEAR ALL + LABELS AND ANNOTATION OFF
CLEAR LABELS + LABELS:CLICK
CLICK - click to add/delete labels/annotations.
AUTO - same as CLICK plus labels/annotations will be automatically added to newly plotted or tagged samples. Unfortunately adding new labels and annotations becomes very slow when there is too much of them, so there is a limit for the AUTO setting - 250 labels or 20 annotations at once.
Annotations are editable. They can be dragged to another place and text can be changed. Text can be also wrapped into an HTML SPAN element and some styles can be used, like "font-size" or "color". BR element (new line) works too.
HIGHLIGHT CLICK/OFF/HOVER - highlight all samples that belong to a single population. Set to HOVER to ignore clicks. Set to OFF to disable this feature and to remove highlight triggered by hover (highlights triggered by clicks will stay until they will be cleared or removed by a click). Click white dot to cycle trough available highlight colors.
Plotly buttons:
Default download is set to 1600x1200px PNG.
Custom Plotly buttons:
"Toggle projection: orthographic / perspective" - self-explanatory.
"Toggle background color" - cycles trough dark grey, black, white and light grey. Text color and white highlight will be switched to black when background will be set to white or light grey.
"Toggle color scheme" - cycles trough several gradients.
"Reverse color scheme" - reverses all gradients permanently.
"Download plot as png (custom size)" - default size is the size of the currently displayed plot.
