search this blog

Tuesday, December 29, 2020

Fully automated graph exploration


Scientists at Broad MIT are working on a new feature-packed and "lightning fast" version of Admixtools that runs in R. It's already available via this link...

uqrmaie1.github.io/admixtools

I don't have access to a Linux machine right now, but since this thing runs in R then it also runs in Windows, and I do have a Windows computer here.

One of the most interesting and useful features in the new R package is arguably the find_graphs function, which automatically searches for admixture graphs that reflect the observed f-statistics. That is, once the user chooses the samples and settings, find_graphs runs an unsupervised admixture graph analysis.

Here are a couple of graphs that I knocked out with find_graphs in about five minutes each. The commands and settings that I used are listed in a text file here.


The two topologies above were among the most commonly seen in a series of about 50 runs with the same sample set. A couple of basic inferences based on the output:

- RUS_Progress-Vonyuchka_En harbors GEO_Kotias-Satsurblia_HG-related ancestry, not IRN_Ganj_Dareh_N-related ancestry

- IRN_Ganj_Dareh_N and TKM_Geoksyur_En form a clade to the exclusion of GEO_Kotias-Satsurblia_HG.

The results are certainly in line with those from other types of analyses that I've done on this blog (for instance, see here and here).

Update 05/01/21: Robert Maier, one of the creators of Admixtools2, has left this message in the comments below.

I'm glad to see that there is so much interest in Admixtools2! I very much appreciate any comments and suggestions on how to improve it and how to make it more user friendly.

Because it's still under active development, some things are likely to change in the future. For example, there is a faster successor to "find_graphs", called "find_graphs2", but in the future they will probably be merged into one.

I'm in David Reich’s group at Harvard and Broad and we are hoping to publish a paper describing Admixtools2 where we illustrate its value by using it to test how robust several previously published results are by exploring a large number of alternative models for each of them. If any of you use Admixtools2 to find graphs that are significantly better fits than published graphs and are also historically plausible - or if you find families of graphs that are equally good fits to the published ones but provide qualitatively different conclusions about population relationships - please contact us. That would be a meaningful contribution to the paper we write about this and we’d be open to including someone as a co-author based on identifying case studies like this.

Sunday, December 6, 2020

Looking forward to a post-Covid world


I was hoping that the Covid-19 pandemic wouldn't have an immediate impact on the publication of ancient DNA papers and new data, but considering how much things have slowed down in this respect, it seems that I was fooling myself.

So let's take a break until early next year, and then see what happens.

Trust me, we've got a lot to look forward to in the post-Covid-19 world. Based on what I've heard from various sources, here are some predictions about what we might see:

- the search for the Proto-Indo-European homeland will shift west to the North Pontic steppe

- on the other hand, the search for the Proto-Uralic homeland will move deep into Siberia

- the key role of the Single Grave (westernmost Corded Ware) culture in the population history of Western Europe will finally get some attention

- following on from the above, Y-haplogroup R1b-L51 will be revealed as a Single Grave marker

- the idea that the Pontic-Caspian steppe was colonized by migrants from Mesopotamia during the Bronze Age will be forgotten, and, ironically, we'll instead learn that there was a significant influx of steppe ancestry into ancient Mesopotamia

- Old Kingdom Egyptians will come out less Sub-Saharan African than present-day Egyptians.

I probably shouldn't blab everything out, so that's all you're getting from me for now. You'll just have to wait for the rest until next year, or perhaps even the year after that.

See also...

Saturday, November 7, 2020

Slavic-like Medieval Germans


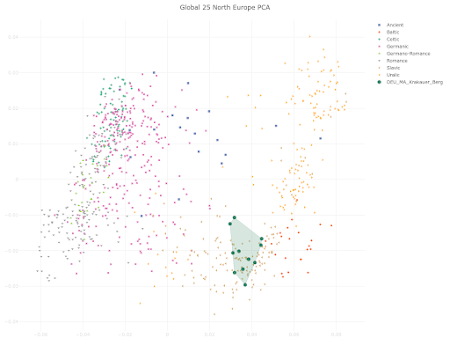
The samples labeled DEU_MA_Krakauer_Berg in the Principal Component Analysis (PCA) plot below are from a recent paper by Parker et al. at Scientific Reports. Their remains were excavated from a Medieval cemetery in the now abandoned village of Krakauer Berg in eastern Germany.

Krakauer sounds sort of like Kraków, doesn't it? That's probably not a coincidence, especially considering how these people behave in my analysis. To see an interactive version of the plot, paste the coordinates from the text file here into the relevant field here.

See also...

Yamnaya-related ancestry proportions in present-day Poles

Warriors from at least two different populations fought in the Tollense Valley battle

Viking world open analysis and discussion thread

Tuesday, September 29, 2020

Viking world open analysis and discussion thread


Global25 and Celtic vs Germanic coordinates for most of the samples from the recent Margaryan et al. Viking paper are now available HERE and HERE, respectively. Look for the VK2020 prefix.

Feel free to put them through their paces and let me know what you find. Below are a couple of examples of what can be done with these coordinates using Vahaduo Global25 Views.

See also...

Viking invasion at bioRxiv

Commoner or elite?

Who were the people of the Nordic Bronze Age?

Tuesday, September 8, 2020

Warriors from at least two different populations fought in the Tollense Valley battle


I can't get the genotype data from the Burger et al. paper. The lead authors, Joachim Burger and Daniel Wegmann, aren't replying to my emails.

But they were gracious enough to release the BAM files for each of their samples, and these files can be converted to genotype data. So I've included ten of the Tollense Valley warriors (DEU_Tollense_BA) in the Global25 datasheets (see here).

The claim in the paper that these warriors "represent an unstructured population" is absolutely false and extremely naive.

Below are a couple of Principal Component Analysis (PCA) plots produced with Vahaduo Global25 views. The samples are labeled according to their Y-chromosome haplogroups. To see interactive versions of the same plots, paste the Global25 coordinates from the text file here into the relevant fields here.


These warriors are not a single unstructured population, because they cover too much ground in the above plots for that to be possible. It's clear to me that they represent at least two different groups from Central Europe and surrounds.

Of course, this would be a lot easier to work out if Burger et al. cared to supply more information about each of the warriors, such as their attire, weapons, circumstances of death, and so on. It's a complete mystery to me why this wasn't included in the paper, and the authors are refusing to talk to me, so it's unlikely that I'll ever be able to get it from them.

In the absence of such crucial archeological and anthropological data, I don't want to speculate too much, and get overly creative, but here are a couple of possible scenarios to explain the ancient DNA results:
- this may have been a battle between two Central European armies, one rich in Y-haplogroup R1b and the other rich in Y-haplogroup I2a, as well as their allies or hired help, including warriors from Eastern Europe belonging to Y-haplogroup R1a

- or perhaps it was an invasion from the east by warriors rich in Y-haplogroup R1a, and it was a success, with the local armies, rich in Y-haplogroups R1b and I2a, losing the battle and suffering most of the casualties.

I'm sure that one day someone will attempt to undertake a decent multidisciplinary study of this epic battle, and we'll at least have a rough idea about what happened. Or not.

Citation...

Burger et al., Low Prevalence of Lactase Persistence in Bronze Age Europe Indicates Ongoing Strong Selection over the Last 3,000 Years, Current Biology, Available online 3 September 2020, https://doi.org/10.1016/j.cub.2020.08.033

See also...

Genetic and linguistic structure across space and time in Northern Europe

Wednesday, August 19, 2020

Yamnaya-related ancestry proportions in present-day Poles


Modeling ancient ancestry proportions in present-day Europeans with the qpAdm software is now a lot more difficult. The reasons for this are updates to qpAdm as well as the availabiity of more useuful outgroups or right pops.

This isn't necessarily a bad thing, because users are forced to work harder to find successful models, which is likely to lead to some interesting discoveries. But it can be very frustrating.

I don't think that settling for poor statistical fits or using a small number of outrgoups are acceptable short cuts. Perhaps sequencing modern-day samples in exactly the same way as the ancient samples, and thus increasing the compatability between them, might help?

Limiting qpAdm runs to higher quality SNPs from transversion sites does help, but perhaps largely because of the significant reduction in markers?

In any case, I've now given up on running such analyses, at least until I see some serious pointers on the topic from Harvard's qpAdm experts. But before I put this project to bed for the time being, I'd like to share some new results for Poles from eastern and western Poland, respectively.

right pops:

CMR_Shum_Laka_8000BP
MAR_Taforalt
IRN_Ganj_Dareh_N
Levant_PPNB
GEO_CHG
TUR_Barcin_N
RUS_Piedmont_En
SRB_Iron_Gates_HG
WHG
RUS_Karelia_HG
MNG_North_N
RUS_Ust_Kyakhta

left pops:

Polish_East
CWC_Baltic_early 0.572±0.024
SWE_TRB 0.428±0.024
chisq 11.776
tail prob 0.300296
Full output

Polish_West
CWC_Baltic_early 0.587±0.021
SWE_TRB 0.413±0.021
chisq 11.165
tail prob 0.34478
Full output


Even using transversion sites, this is one of the very few combinations of ancient reference samples that works for the Poles with these right pops. That is, the combination of early Corded Ware samples from the East Baltic (CWC_Baltic_early) and Funnel Beaker samples from Scandinavia (SWE_TRB). The former are obviously the proxy here for Yamnaya-related ancestry.

Adding any sort of hunter-gatherer population to this model doesn't help or even makes things worse (for instance, see here and here). It is possible to add Baltic hunter-gatherers to a similar model after dropping CWC_Baltic_early in favor of closely related samples from the Early to Middle Bronze Age Pontic-Caspian steppe. Note, however, that the statistical fits are somewhat poorer.

Polish_East
Baltic_LTU_Narva 0.032±0.014
PC_steppe_EMBA 0.483±0.019
SWE_TRB 0.485±0.019
chisq 17.143
tail prob 0.0465198
Full output

Polish_West
Baltic_LTU_Narva 0.031±0.011
PC_steppe_EMBA 0.491±0.015
SWE_TRB 0.477±0.016
chisq 22.444
tail prob 0.00757421
Full output


Interestingly, but not surprisingly, the ancestry of many present-day Northwestern European populations can be modeled in basically the same way. That's because ancient ancestry proportions are more closely correlated with latitude than longitude across much of the European continent.

English_Kent
CWC_Baltic_early 0.527±0.024
SWE_TRB 0.473±0.024
chisq 13.042
tail prob 0.221357
Full output

Icelandic
CWC_Baltic_early 0.586±0.023
SWE_TRB 0.414±0.023
chisq 16.517
tail prob 0.085751
Full output

Scottish
CWC_Baltic_early 0.583±0.021
SWE_TRB 0.417±0.021
chisq 12.144
tail prob 0.275536
Full output


A zip file with the qpAdm output from this analysis and a list of the most relevant ancients is available here. I might try to run a few more populations over the next few days, but probably only from the northern half of Europe, so please check the zip file in a week or so to see what else is in there.

If anyone wants to challenge my results, note that these and very similar samples are freely available to the public via Harvard University here and here.

Update 22/08/2020: From Nick Patterson (Broad) in the comments:
My general advice for qpAdm is 1) Work on the right hand set. Don't include irrelevant population (except for one population as an outgroup); picking the best RHS can dramatically reduce s. errors on the admixture weights. 2) If qpAdm gives a very low p-value try and understand why, sometimes it is telling you that the target is not a mixture of the sources but sometimes the assumptions are violated, for example recent gene-flow from left pops -> right.

See also...

Ancient ancestry proportions in present-day Europeans

Friday, August 14, 2020

Awesome new toys from Vahaduo


Vahaduo now offers a 3D PCA experience. Check it out HERE and HERE. Below are a couple of screen caps of me messing around with the new tools.


Vahaduo says:

Hi everyone!

New tool - PCA 3D Viewer.

Global 25 version:

https://vahaduo.github.io/3d/g25

West Eurasia version:

https://vahaduo.github.io/3d/we


Usage:

Dots - ancients, circles - moderns.

Click X, Y, Z or COLOR tab and then click one of the PCx buttons to switch dimensions.

Click already active X, Y, Z or COLOR tab to temporarily reverse selected dimension. It will be restored to a default state when any of the dimensions will be switched to another one.

ADD CUSTOM POINTS - self-explanatory. Points will be added as "+". IMPORTANT - G25 version takes NON-SCALED coordinates. This will be true for any new tool dedicated to G25 and coordinates will be scaled automatically when needed or desired.

"Type parts of names." + TAG button - type parts of names to tag certain samples (try for example "KK1 Afon Pinar"). Search is Case Sensitive. Points will be redrawn as "x".

Next row - Labels and Annotations. Click the right button to cycle trough:

CLEAR LABELS + LABELS:AUTO
CLEAR ANNOTATIONS + ANNOTATIONS:CLICK
CLEAR ANNOTATIONS + ANNOTATIONS:AUTO
CLEAR ALL + LABELS AND ANNOTATION OFF
CLEAR LABELS + LABELS:CLICK

CLICK - click to add/delete labels/annotations.
AUTO - same as CLICK plus labels/annotations will be automatically added to newly plotted or tagged samples. Unfortunately adding new labels and annotations becomes very slow when there is too much of them, so there is a limit for the AUTO setting - 250 labels or 20 annotations at once.

Annotations are editable. They can be dragged to another place and text can be changed. Text can be also wrapped into an HTML SPAN element and some styles can be used, like "font-size" or "color". BR element (new line) works too.

HIGHLIGHT CLICK/OFF/HOVER - highlight all samples that belong to a single population. Set to HOVER to ignore clicks. Set to OFF to disable this feature and to remove highlight triggered by hover (highlights triggered by clicks will stay until they will be cleared or removed by a click). Click white dot to cycle trough available highlight colors.

Plotly buttons:

Default download is set to 1600x1200px PNG.

Custom Plotly buttons:
"Toggle projection: orthographic / perspective" - self-explanatory.
"Toggle background color" - cycles trough dark grey, black, white and light grey. Text color and white highlight will be switched to black when background will be set to white or light grey.
"Toggle color scheme" - cycles trough several gradients.
"Reverse color scheme" - reverses all gradients permanently.
"Download plot as png (custom size)" - default size is the size of the currently displayed plot.

See also...

New Global25 interpretation tools

Monday, July 27, 2020

Ancient ancestry proportions in present-day Europeans (to be continued)


This year has already been massive in all sorts of ways, including for new data and software releases. So I'm thinking it might be time to update many of the analyses that were featured at this blog a while ago.

Let's start with the classic hunter vs farmer vs herder mixture model for present-day European populations. The rules of the game are as follows:


- run the latest version of qpAdm using qpfstats output

- use transversion sites and 1240K capture data

- pick a set of diverse and chronologically sound outgroups

- for a model to be successful the p-value must reach 0.01

- tweak the left pops in models that are clearly underperforming

- follow high end scientific literature, logic and common sense


Obviously, the reason that I decided to limit my analysis to markers from transversion sites is to mitigate problems associated with modeling the ancestry of modern, high quality samples with relatively low quality ancients. One of these problems appears to be qpAdm assigning faux East Asian/Siberian admixture to present-day Europeans (for instance, see figure 4 here).

My starting reference populations and outgroups are listed below. In qpAdm terminology the former are known as the "left pops", while the latter as the "right pops". Most of these samples are freely available at the David Reich Lab website here.

left pops:
HUN_Koros_N_HG
TUR_Barcin_N
UKR_Yamnaya

right pops:
CMR_Shum_Laka_8000BP
MAR_Taforalt
Levant_Natufian
IRN_Ganj_Dareh_N
Levant_PPNB
CZE_Vestonice16
BEL_GoyetQ116-1
Iberia_ElMiron
RUS_Karelia_HG
RUS_West_Siberia_HG
MNG_North_N
RUS_Ust_Kyakhta

As you can see, I picked a wide variety of right pops. But I chose most of them specifically to be able to differentiate the three streams of ancestry - from ancient hunters, farmers and herders - that are the focus of my analysis. I also intentionally avoided using samples in the right pops that may have experienced gene flow, including cryptic gene flow, from the populations in the left pops.

I somewhat speculatively earmarked HUN_Koros_N_HG, from the Early Neolithic Carpathian Basin, and UKR_Yamnaya, from the Early Bronze Age North Pontic steppe in what is now Ukraine, to represent the hunter-gatherer and pastoralist streams of ancestry, respectively.

That's because I expected HUN_Koros_N_HG to be the best proxy for the hunter-gatherer ancestry that was initially absorbed by the early farmers who fanned out from the Aegean region across much of the European continent, and of course it made sense to choose a steppe pastoralist population that was located close to Central Europe where such groups first made the biggest impact outside of the steppe.

Interestingly, HUN_Koros_N_HG and UKR_Yamnaya did prove to be among most effective choices for the types of ancestries that they represented. For instance, UKR_Yamnaya generally produced much stronger statistical fits than a very similar set of Yamnaya samples from the Caspian steppe (more precisely, from the Samara region in Russia). However, this might well be an artifact, due to very specific characteristics of these few ancient individuals. Larger sample sets would be welcome, especially from Yamnaya sites in Ukraine.

Below, dear audience, is a spreadsheet featuring the preliminary results. Click on the image to view and/or download the spreadsheet. The general rule is that the higher the tail prob, or p-value, the more likely it is that the ancestry proportions are close to the truth (a tail prob of well below 0.05 is usually a strong indication that something isn't right). For a detailed look at each of the qpAdm runs, feel free to consult the zip file here.


Note, however, that many of the European groups in my burgeoning genotype dataset are yet to make an appearance in the spreadsheet. That's because their models with the standard left pops showed p-values well under 0.01, which essentially meant that they failed, and I'm still trying to make them work.

But round one has certainly revealed some fascinating stuff. For instance, except for Hungarians and Estonians, none of the Uralic-speaking groups can be modeled successfully in the standard three-way model.

However, I managed to significantly improve the statistical fits in their models by adding a Siberian population, RUS_Baikal_BA, to the left pops. This is unlikely to be a coincidence, because the Proto-Uralic homeland was almost certainly located in or very near Siberia. Iain Mathieson please take note.

Saami
HUN_Koros_N_HG 0.134±0.043
RUS_Baikal_BA 0.270±0.015
TUR_Barcin_N 0.081±0.026
UKR_Yamnaya 0.515±0.058
chisq 19.865
tail prob 0.0108571

See also...


Tuesday, July 21, 2020

The oldest R1a to date


My popular map of the oldest instances of Y-haplogroup R1a in the ancient DNA record has a new entry: PES001 from the recent Saag et al. preprint. PES001 comes from a burial site in what is now northwestern Russia and is dated to a whopping 10785–10626 calBCE.


Indeed, I'm not aware of any R1a samples older than PES001 among the treasure trove of thousands of ancient samples waiting to be published. So it's likely that this individual will remain the oldest member of our R1a clan for some years to come.

See also...

Y-haplogroup R1a and mental health

Like three peas in a pod

The mystery of the Sintashta people

Tuesday, July 14, 2020

First taste of Early Medieval DNA from the Ural region (Csaky et al. 2020 preprint)


Over at bioRxiv at this LINK. From the preprint:

The ancient Hungarians originated from the Ural region of Russia, and migrated through the Middle-Volga region and the Eastern European steppe into the Carpathian Basin during the 9th century AD. Their Homeland was probably in the southern Trans-Ural region, where the Kushnarenkovo culture disseminated. In the Cis-Ural region Lomovatovo and Nevolino cultures are archaeologically related to ancient Hungarians. In this study we describe maternal and paternal lineages of 36 individuals from these regions and nine Hungarian Conquest period individuals from today's Hungary, as well as shallow shotgun genome data from the Trans-Uralic Uyelgi cemetery. We point out the genetic continuity between the three chronological horizons of Uyelgi cemetery, which was a burial place of a rather endogamous population. Using phylogenetic and population genetic analyses we demonstrate the genetic connection between Trans-, Cis-Ural and the Carpathian Basin on various levels. The analyses of this new Uralic dataset fill a gap of population genetic research of Eurasia, and reshape the conclusions previously drawn from 10-11th century ancient mitogenomes and Y-chromosomes from Hungary.

...

Majority of Uyelgi males belonged to Y chromosome haplogroup N, and according to combined STR, SNP and Network analyses they belong to the same subclade within N-M46 (also known as N-tat and N1a1-M46 in ISOGG 14.255). N-M46 nowadays is a geographically widely distributed paternal lineage from East of Siberia to Scandinavia 33 . One of its subclades is N-Z1936 (also known as N3a4 and N1a1a1a1a2 in ISOGG 14.255), which is prominent among Uralic speaking populations, probably originated from the Ural region as well and mainly distributed from the West of Ural Mountains to Scandinavia (Finland). Seven samples of Uyelgi site most probably belong to N-Y24365 (also known as N-B545 and N1a1a1a1a2a1c2 in ISOGG 14.255) under N-Z1936, a specific subclade that can be found almost exclusively in todays’ Tatarstan, Bashkortostan and Hungary 17 (ISOGG, Yfull).


Csaky et al., Early Medieval Genetic Data from Ural Region Evaluated in the Light of Archaeological Evidence of Ancient Hungarians, bioRxiv, Posted July 13, 2020, doi: https://doi.org/10.1101/2020.07.13.200154

See also...

Hungarian Conquerors were rich in Y-haplogroup N

On the association between Uralic expansions and Y-haplogroup N

More on the association between Uralic expansions and Y-haplogroup N

Ancient DNA confirms the link between Y-haplogroup N and Uralic expansions